Originally, I was planning to write a Further Exploration post on just Treemap variations. I thought there would only be a small, handle-full of charts that I would need to cover.
But man, I was wrong.
Once I actually sat down and begun researching into other Treemap types out there, I found myself surprised and overwhelmed.
This was largely thanks to the work done by Hans-Jörg Schulz in his treeviz.net project. If you haven’t seen this site before, I’d recommend you checking it out. It’s a library of charts that specialise in visualising hierarchal or tree data.
Anyway, instead of doing a single post on Treemap variations, which would be way too long, I’ve instead opted to break down the charts I’ve found into
3D Treemap Cubes
The earliest writing I came across on 3D Treemaps was from Brain Johnson’s 1993 dissertation Treemaps: Visualizing Hierarchical and Categorical Data (see page 45, Figure 4.6).
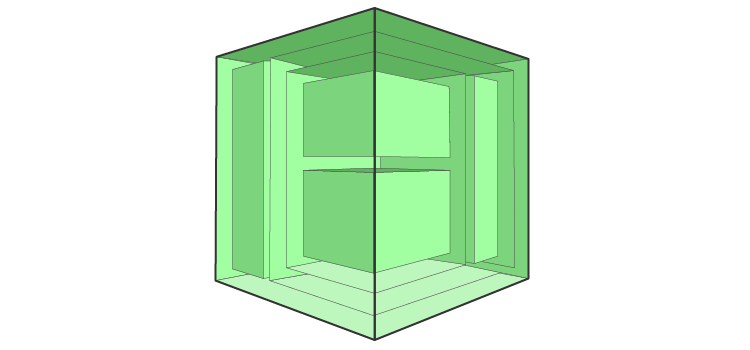
This type of 3D Treemap uses a cube design that has multiple layers within it, like an onion.
Since we live in a 3-D world our point of view is necessarily “within” the partitioning space of higher dimension treemaps (3 or more partitioning dimensions). Higher dimension treemaps require transparent or translucent nodes in order to make internal partitions visible from external points of view. Point of view can be interactively controlled and users can fly through 3-D partitionings but global perspectives require external views of the entire hierarchy.
Treemaps: Visualizing Hierarchical and Categorical Data, Johnson, p. 42 – 45
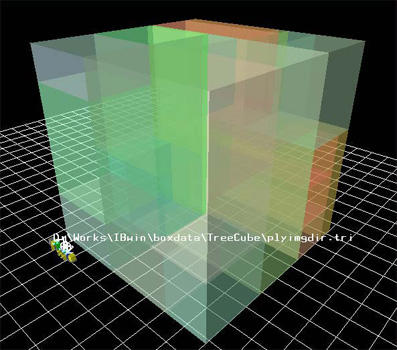
The Information Cube
In the same year, Jun Rekimoto and Mark Green in their paper The Information Cube: Using Transparency in 3D Information Visualization unveiled their version of a 3D Treemap.
Here, transparent cubes are nested inside one another, and category labels are also displayed in 3D. Much of this design was done with virtual reality technology in mind, as various 3D interaction techniques were provided and taken into consideration.

The Treecube
A decade later, Y. Tanaka, Y. Okada and K. Niijima would also explore how to bring a Treemap into the 3D realm by using a cube design. In their paper Treecube:
Yoshihiro Okada, together with Seiji Okajima would later also improve on the Treecube’s design in their paper Treecube+3D-ViSOM: Combinational Visualization Tool for Browsing 3D Multimedia Data.
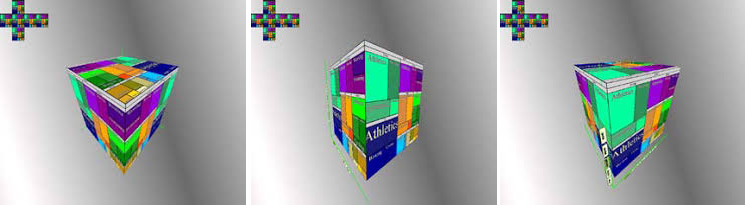
The Magic Treemap Cube
Another 3D Treemap cube I came across, but couldn’t find too much information on was the “Magic Treemap Cube” created by Xiaowu Chen, Haolin Yang, Yongtao Ma and Bin Zhou.
[…] we present a novel extension called magic treemap cube, which improves the layout and has a good performance on visualizing unfixed (cross-level) and complex data, inverting hierarchy without reorganizing the structure, and enabling users to easily compare among treemaps. […]
International Journal of Virtual Reality; 2010, Vol. 9, Issue 3, p. 9
As you can see below, this design somewhat resembles a Rubik’s Cube. The Magic Treemap Cube was apparently used in an application called OlympicViz to visualise data for the Beijing 2008 Olympic games.