AWS Big Data Blog
Estimating Scope 1 Carbon Footprint with Amazon Athena
Today, more than 400 organizations have signed The Climate Pledge, a commitment to reach net-zero carbon by 2040. Some of the drivers that lead to setting explicit climate goals include customer demand, current and anticipated government relations, employee demand, investor demand, and sustainability as a competitive advantage. AWS customers are increasingly interested in ways to drive sustainability actions. In this blog, we will walk through how we can apply existing enterprise data to better understand and estimate Scope 1 carbon footprint using Amazon Simple Storage Service (S3) and Amazon Athena, a serverless interactive analytics service that makes it easy to analyze data using standard SQL.
The Greenhouse Gas Protocol
The Greenhouse Gas Protocol (GHGP) provides standards for measuring and managing global warming impacts from an organization’s operations and value chain.
The greenhouse gases covered by the GHGP are the seven gases required by the UNFCCC/Kyoto Protocol (which is often called the “Kyoto Basket”). These gases are carbon dioxide (CO2), methane (CH4), nitrous oxide (N2O), the so-called F-gases (hydrofluorocarbons and perfluorocarbons), sulfur hexafluoride (SF6) nitrogen trifluoride (NF3). Each greenhouse gas is characterized by its global warming potential (GWP), which is determined by the gas’s greenhouse effect and its lifetime in the atmosphere. Since carbon dioxide (CO2) accounts for about 76 percent of total man-made greenhouse gas emissions, the global warming potential of greenhouse gases are measured relative to CO2, and are thus expressed as CO2-equivalent (CO2e).
The GHGP divides an organization’s emissions into three primary scopes:
- Scope 1 – Direct greenhouse gas emissions (for example from burning fossil fuels)
- Scope 2 – Indirect emissions from purchased energy (typically electricity)
- Scope 3 – Indirect emissions from the value chain, including suppliers and customers
How do we estimate greenhouse gas emissions?
There are different methods to estimating GHG emissions that includes the Continuous Emissions Monitoring System (CEMS) Method, the Spend-Based Method, and the Consumption-Based Method.
Direct Measurement – CEMS Method
An organization can estimate its carbon footprint from stationary combustion sources by performing a direct measurement of carbon emissions using the CEMS method. This method requires continuously measuring the pollutants emitted in exhaust gases from each emissions source using equipment such as gas analyzers, gas samplers, gas conditioning equipment (to remove particulate matter, water vapor and other contaminants), plumbing, actuated valves, Programmable Logic Controllers (PLCs) and other controlling software and hardware. Although this approach may yield useful results, CEMS requires specific sensing equipment for each greenhouse gas to be measured, requires supporting hardware and software, and is typically more suitable for Environment Health and Safety applications of centralized emission sources. More information on CEMS is available here.
Spend-Based Method
Because the financial accounting function is mature and often already audited, many organizations choose to use financial controls as a foundation for their carbon footprint accounting. The Economic Input-Output Life Cycle Assessment (EIO LCA) method is a spend-based method that combines expenditure data with monetary-based emission factors to estimate the emissions produced. The emission factors are published by the U.S. Environment Protection Agency (EPA) and other peer-reviewed academic and government sources. With this method, you can multiply the amount of money spent on a business activity by the emission factor to produce the estimated carbon footprint of the activity.
For example, you can convert the amount your company spends on truck transport to estimated kilograms (KG) of carbon dioxide equivalent (CO₂e) emitted as shown below.
Estimated Carbon Footprint = Amount of money spent on truck transport * Emission Factor [1]
Although these computations are very easy to make from general ledgers or other financial records, they are most valuable for initial estimates or for reporting minor sources of greenhouse gases. As the only user-provided input is the amount spent on an activity, EIO LCA methods aren’t useful for modeling improved efficiency. This is because the only way to reduce EIO-calculated emissions is to reduce spending. Therefore, as a company continues to improve its carbon footprint efficiency, other methods of estimating carbon footprint are often more desirable.
Consumption-Based Method
From either Enterprise Resource Planning (ERP) systems or electronic copies of fuel bills, it’s straightforward to determine the amount of fuel an organization procures during a reporting period. Fuel-based emission factors are available from a variety of sources such as the US Environmental Protection Agency and commercially-licensed databases. Multiplying the amount of fuel procured by the emission factor yields an estimate of the CO2e emitted through combustion. This method is often used for estimating the carbon footprint of stationary emissions (for instance backup generators for data centers or fossil fuel ovens for industrial processes).
If for a particular month an enterprise consumed a known amount of motor gasoline for stationary combustion, the Scope 1 CO2e footprint of the stationary gasoline combustion can be estimated in the following manner:
Estimated Carbon Footprint = Amount of Fuel Consumed * Stationary Combustion Emission Factor[2]
Organizations may estimate their carbon emissions by using existing data found in fuel and electricity bills, ERP data, and relevant emissions factors, which are then consolidated in to a data lake. Using existing analytics tools such as Amazon Athena and Amazon QuickSight an organization can gain insight into its estimated carbon footprint.
The data architecture diagram below shows an example of how you could use AWS services to calculate and visualize an organization’s estimated carbon footprint.
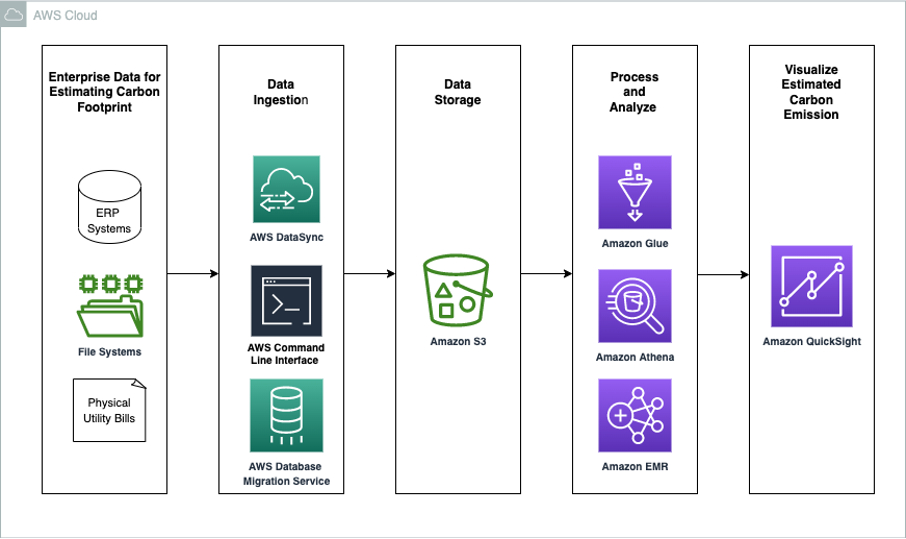
Customers have the flexibility to choose the services in each stage of the data pipeline based on their use case. For example, in the data ingestion phase, depending on the existing data requirements, there are many options to ingest data into the data lake such as using the AWS Command Line Interface (CLI), AWS DataSync, or AWS Database Migration Service.
Example of calculating a Scope 1 stationary emissions footprint with AWS services
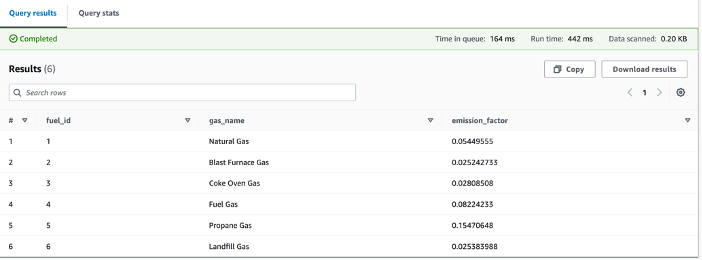
Let’s assume you burned 100 standard cubic feet (scf) of natural gas in an oven. Using the US EPA emission factors for stationary emissions we can estimate the carbon footprint associated with the burning. In this case the emission factor is 0.05449555 Kg CO2e /scf.[3]
Amazon S3 is ideal for building a data lake on AWS to store disparate data sources in a single repository, due to its virtually unlimited scalability and high durability. Athena, a serverless interactive query service, allows the analysis of data directly from Amazon S3 using standard SQL without having to load the data into Athena or run complex extract, transform, and load (ETL) processes. Amazon QuickSight supports creating visualizations of different data sources, including Amazon S3 and Athena, and the flexibility to use custom SQL to extract a subset of the data. QuickSight dashboards can provide you with insights (such as your company’s estimated carbon footprint) quickly, and also provide the ability to generate standardized reports for your business and sustainability users.
In this example, the sample data is stored in a file system and uploaded to Amazon S3 using the AWS Command Line Interface (CLI) as shown in the following architecture diagram. AWS recommends creating AWS resources and managing CLI access in accordance with the Best Practices for Security, Identity, & Compliance guidance.

The AWS CLI command below demonstrates how to upload the sample data folders into the S3 target location.
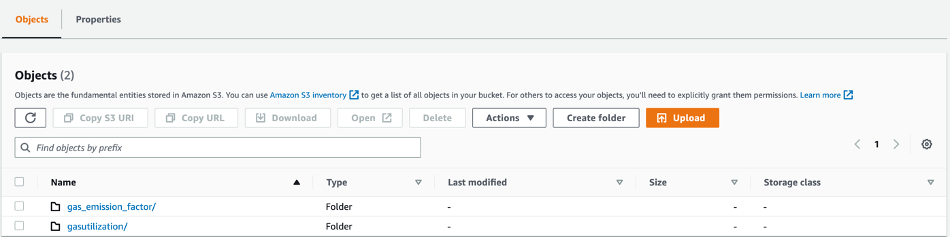
The snapshot of the S3 console shows two newly added folders that contains the files.
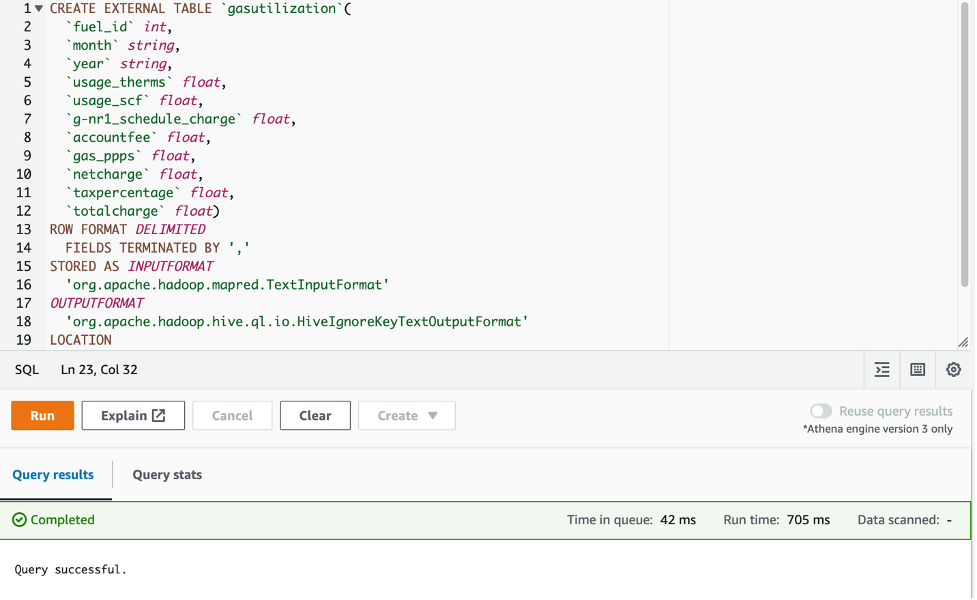
To create new table schemas, we start by running the following script for the gas utilization table in the Athena query editor using Hive DDL. The script defines the data format, column details, table properties, and the location of the data in S3.
 The script below shows another example of using Hive DDL to generate the table schema for the gas emission factor data.
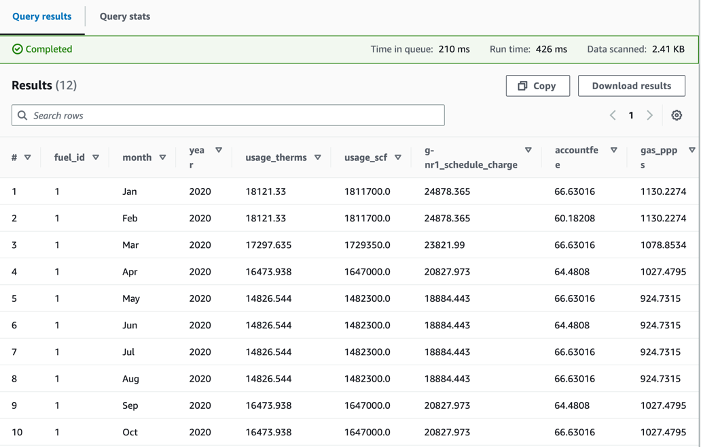
After creating the table schema in Athena, we run the below query against the gas utilization table that includes details of gas bills to show the gas utilization and the associated charges, such as gas public purpose program surcharge (PPPS) and total charges after taxes for the year of 2020:
We are also able to analyze the emission factor data showing the different fuel types and their corresponding CO2e emission as shown in the screenshot.
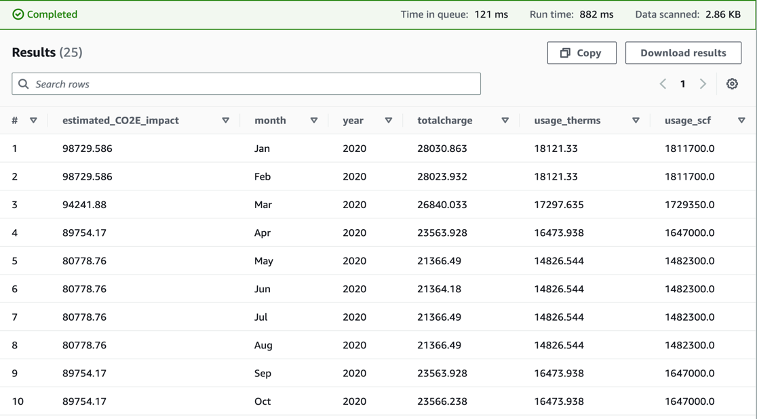
With the emission factor and the gas utilization data, we can run the following query below to get an estimated Scope 1 carbon footprint alongside other details. In this query, we joined the gas utilization table and the gas emission factor table on fuel id and multiplied the gas usage in standard cubic foot (scf) by the emission factor to get the estimated CO2e impact. We also selected the month, year, total charge, and gas usage measured in therms and scf, as these are often attributes that are of interest for customers.
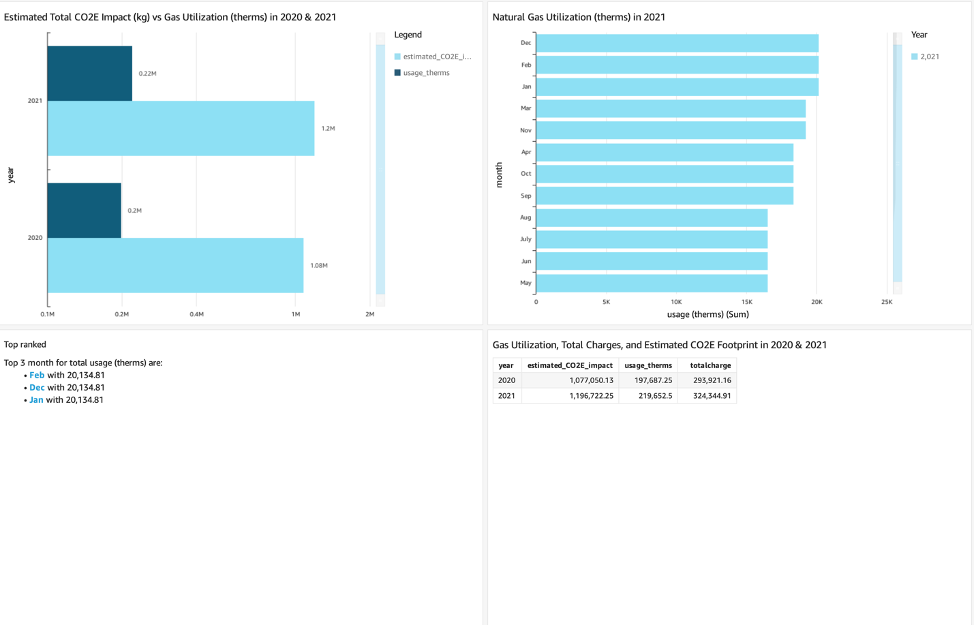
Lastly, Amazon QuickSight allows visualization of different data sources, including Amazon S3 and Athena, and the flexibility to use custom SQL to get a subset of the data. The following is an example of a QuickSight dashboard showing the gas utilization, gas charges, and estimated carbon footprint across different years.
We have just estimated the Scope 1 carbon footprint for one source of stationary combustion. If we were to do the same process for all sources of stationary and mobile emissions (with different emissions factors) and add the results together, we could roll up an accurate estimate of our Scope 1 carbon emissions for the entire business by only utilizing native AWS services and our own data. A similar process will yield an estimate of Scope 2 emissions, with grid carbon intensity in the place of Scope 1 emission factors.
Summary
This blog discusses how organizations can use existing data in disparate sources to build a data architecture to gain better visibility into Scope 1 greenhouse gas emissions. With Athena, S3, and QuickSight, organizations can now estimate their stationary emissions carbon footprint in a repeatable way by applying the consumption-based method to convert fuel utilization into an estimated carbon footprint.
Other approaches available on AWS include Carbon Accounting on AWS, Sustainability Insights Framework, Carbon Data Lake on AWS, and general guidance detailed at the AWS Carbon Accounting Page.
If you are interested in information on estimating your organization’s carbon footprint with AWS, please reach out to your AWS account team and check out AWS Sustainability Solutions.
References
- An example from page four of Amazon’s Carbon Methodology document illustrates this concept.
Amount spent on truck transport: $100,000
EPA Emission Factor: 1.556 KG CO2e /dollar of truck transport
Estimated CO₂e emission: $100,000 * 1.556 KG CO₂e/dollar of truck transport = 155,600 KG of CO2e ↑ - For example,
Gasoline consumed: 1,000 US Gallons
EPA Emission Factor: 8.81 Kg of CO2e /gallon of gasoline combusted
Estimated CO2e emission = 1,000 US Gallons * 8.81 Kg of CO2e per gallon of gasoline consumed= 8,810 Kg of CO2e.
EPA Emissions Factor for stationary emissions of motor gasoline is 8.78 kg CO2 plus .38 grams of CH4, plus .08 g of N2O.
Combining these emission factors using 100-year global warming potential for each gas (CH4:25 and N2O:298) gives us Combined Emission Factor = 8.78 kg + 25*.00038 kg + 298 *.00008 kg = 8.81 kg of CO2e per gallon.↑ - The Emission factor per scf is 0.05444 kg of CO2 plus 0.00103 g of CH4 plus 0.0001 g of N2O. To get this in terms of CO2e we need to multiply the emission factor of the other two gases by their global warming potentials (GWP). The 100-year GWP for CH4 and N2O are 25 and 298 respectively. Emission factors and GWPs come from the US EPA website. ↑
About the Authors
 Thomas Burns, SCR, CISSP is a Principal Sustainability Strategist and Principal Solutions Architect at Amazon Web Services. Thomas supports manufacturing and industrial customers world-wide. Thomas’s focus is using the cloud to help companies reduce their environmental impact both inside and outside of IT.
 Aileen Zheng is a Solutions Architect supporting US Federal Civilian Sciences customers at Amazon Web Services (AWS). She partners with customers to provide technical guidance on enterprise cloud adoption and strategy and helps with building well-architected solutions. She is also very passionate about data analytics and machine learning. In her free time, you’ll find Aileen doing pilates, taking her dog Mumu out for a hike, or hunting down another good spot for food! You’ll also see her contributing to projects to support diversity and women in technology.