A Variable Width Box Plot is a variation of the standard Box Plot where the width of the box is proportional to the size of the group or data subset being represented. This allows for visualising the relative sizes of different groups in addition to their distributions. This helps to provide more context by showing which groups have more data points contributing to their distributions.

Therefore, Variable Width Box Plots are particularly useful when the categories or groups being compared have varying sample sizes. If a box is very narrow, then this can indicate that the distribution may not be too reliable.
Making the box width proportional to the square root of the size of the group is a popular practice with this chart.
Tools that can generate this chart:
R
Examples
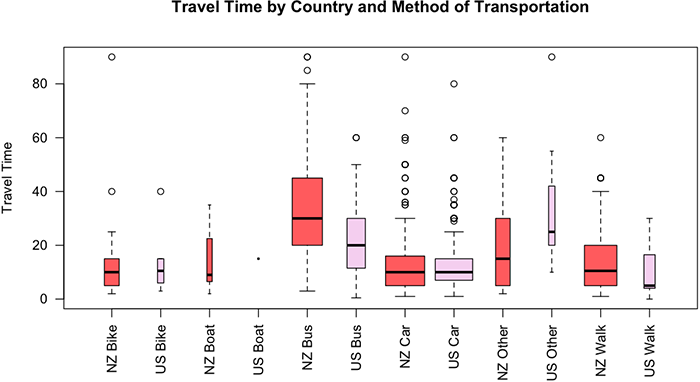
Travel Time by Country and Method of Transportation
How to make boxplots varied widths based on # of responses and sample size in R — Stackoverflow
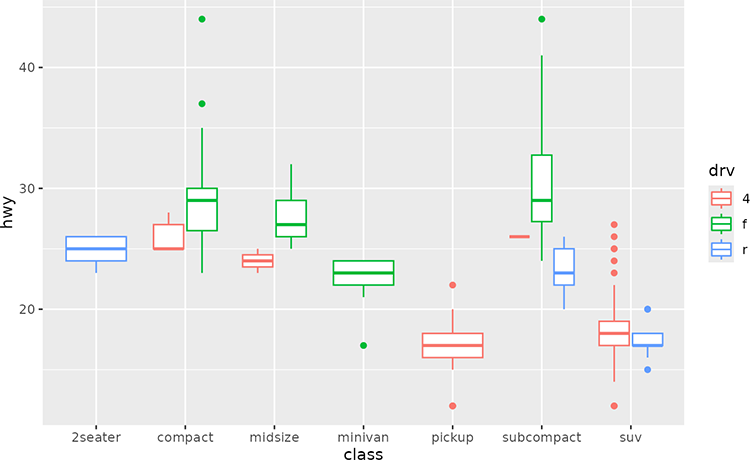
A box and whiskers plot (in the style of Tukey) — ggplot2
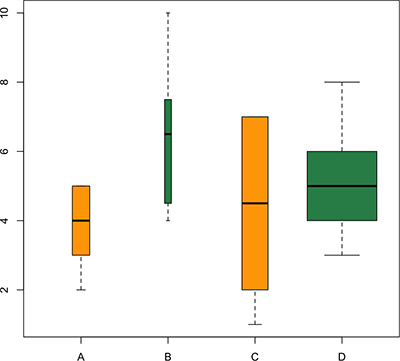
Boxplot with variable width — The R Graph Gallery
Related Posts:
Chart Snapshot: Notched Box Plots
Further Exploration #4 Box Plot Variations

