Utilizing Pandas AI for Data Analysis
Bring the latest AI implementation to Pandas to improve your data workflow.
Are you proficient in the data field using Python? If so, I bet most of you use Pandas for data manipulation.
If you don’t know, Pandas is an open-source Python package specifically developed for data analysis and manipulation. It’s one of the most-used packages and one you usually learn when starting a data science journey in Python.
So, what is Pandas AI? I guess you are reading this article because you want to know about it.
Well, as you know, we are in a time when Generative AI is everywhere. Imagine if you can perform data analysis on your data using Generative AI; things would be much easier.
This is what Pandas AI brings. With simple prompts, we can quickly analyze and manipulate our dataset without sending our data somewhere.
This article will explore how to utilize Pandas AI for Data Analysis tasks. In the article, we will learn the following:
- Pandas AI Setup
- Data Exploration with Pandas AI
- Data Visualization with Pandas AI
- Pandas AI Advanced usage
If you are ready to learn, let’s get into it!
Pandas AI Setup
Pandas AI is a Python package that implements a Large Language Model (LLM) capability into Pandas API. We can use standard Pandas API with Generative AI enhancement that turns Pandas into a conversational tool.
We mainly want to use Pandas AI because of the simple process that the package provides. The package could automatically analyze data using a simple prompt without requiring complex code.
Enough introduction. Let’s get into the hands-on.
First, we need to install the package before anything else.
pip install pandasai
Next, we must set up the LLM we want to use for Pandas AI. There are several options, such as OpenAI GPT and HuggingFace. However, we will use the OpenAI GPT for this tutorial.
Setting the OpenAI model into Pandas AI is straightforward, but you would need the OpenAI API Key. If you don’t have one, you can get on their website.
If everything is ready, let’s set up the Pandas AI LLM using the code below.
from pandasai.llm import OpenAI

llm = OpenAI(api_token="Your OpenAI API Key")
You are now ready to do Data Analysis with Pandas AI.
Data Exploration with Pandas AI
Let’s start with a sample dataset and try the data exploration with Pandas AI. I would use the Titanic data from the Seaborn package in this example.
import seaborn as sns
from pandasai import SmartDataframe

data = sns.load_dataset('titanic')
df = SmartDataframe(data, config = {'llm': llm})
We need to pass them into the Pandas AI Smart Data Frame object to initiate the Pandas AI. After that, we can perform conversational activity on our DataFrame.
Let’s try a simple question.
response = df.chat("""Return the survived class in percentage""")

response
The percentage of passengers who survived is: 38.38%
From the prompt, Pandas AI could come up with the solution and answer our questions.
We can ask Pandas AI questions that provide answers in the DataFrame object. For example, here are several prompts for analyzing the data.
#Data Summary
summary = df.chat("""Can you get me the statistical summary of the dataset""")

#Class percentage
surv_pclass_perc = df.chat("""Return the survived in percentage breakdown by pclass""")

#Missing Data
missing_data_perc = df.chat("""Return the missing data percentage for the columns""")

#Outlier Data
outlier_fare_data = response = df.chat("""Please provide me the data rows that
contains outlier data based on fare column""")
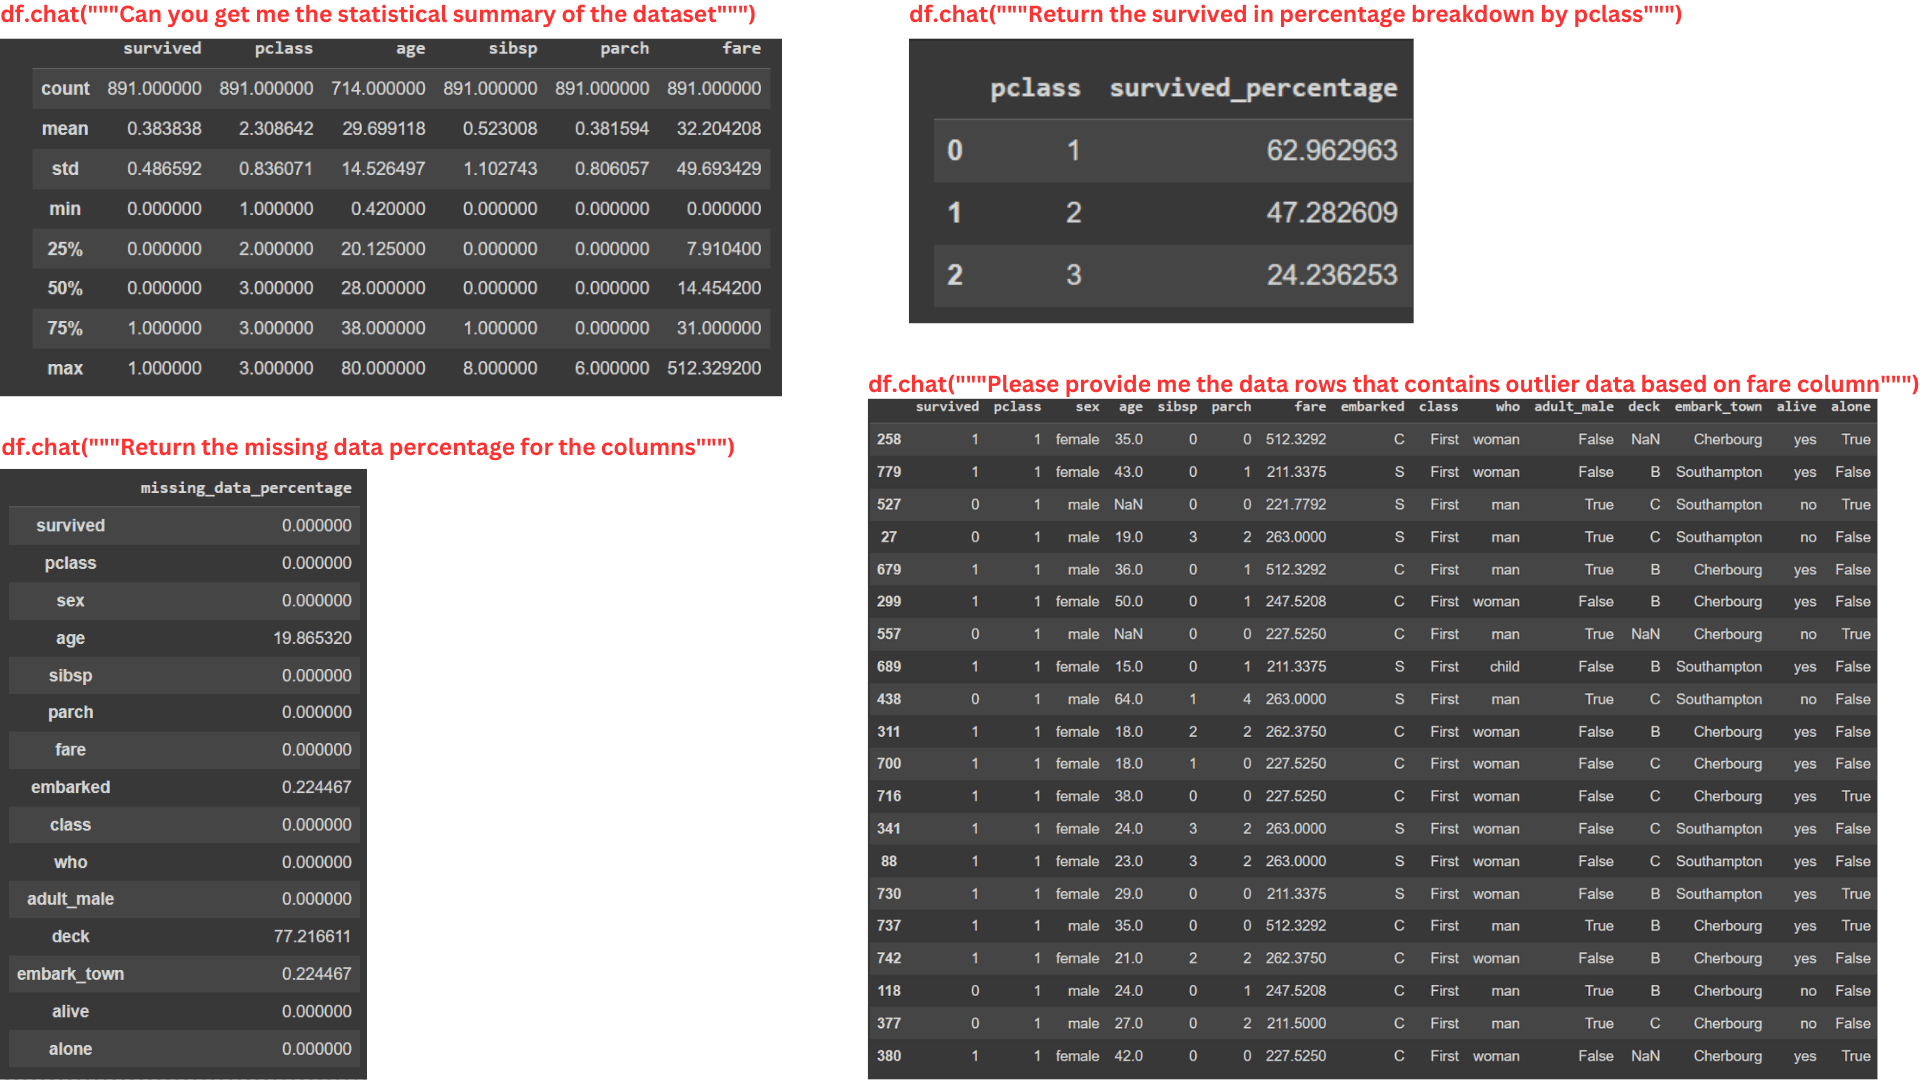
Image by Author
You can see from the image above that the Pandas AI can provide information with the DataFrame object, even if the prompt is quite complex.
However, Pandas AI can’t handle a calculation that is too complex as the packages are limited to the LLM we pass on the SmartDataFrame object. In the future, I am sure that Pandas AI could handle much more detailed analysis as the LLM capability is evolving.
Data Visualization with Pandas AI
Pandas AI is useful for data exploration and can perform data visualization. As long as we specify the prompt, Pandas AI will give the visualization output.
Let’s try a simple example.
response = df.chat('Please provide me the fare data distribution visualization')

response
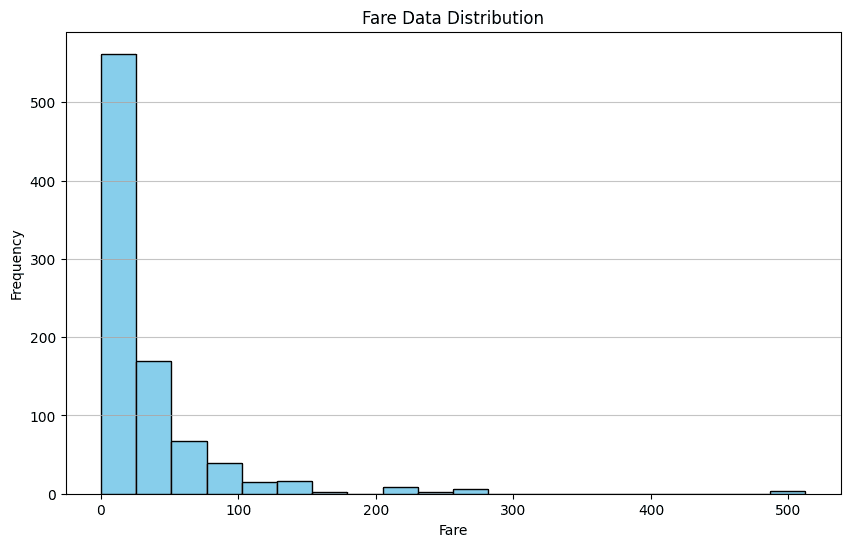
Image by Author
In the example above, we ask Pandas AI to visualize the distribution of the Fare column. The output is the Bar Chart distribution from the dataset.
Just like Data Exploration, you can perform any kind of data visualization. However, Pandas AI still can’t handle more complex visualization processes.
Here are some other examples of Data Visualization with Pandas AI.
kde_plot = df.chat("""Please plot the kde distribution of age column and separate them with survived column""")

box_plot = df.chat("""Return me the box plot visualization of the age column separated by sex""")

heat_map = df.chat("""Give me heat map plot to visualize the numerical columns correlation""")

count_plot = df.chat("""Visualize the categorical column sex and survived""")
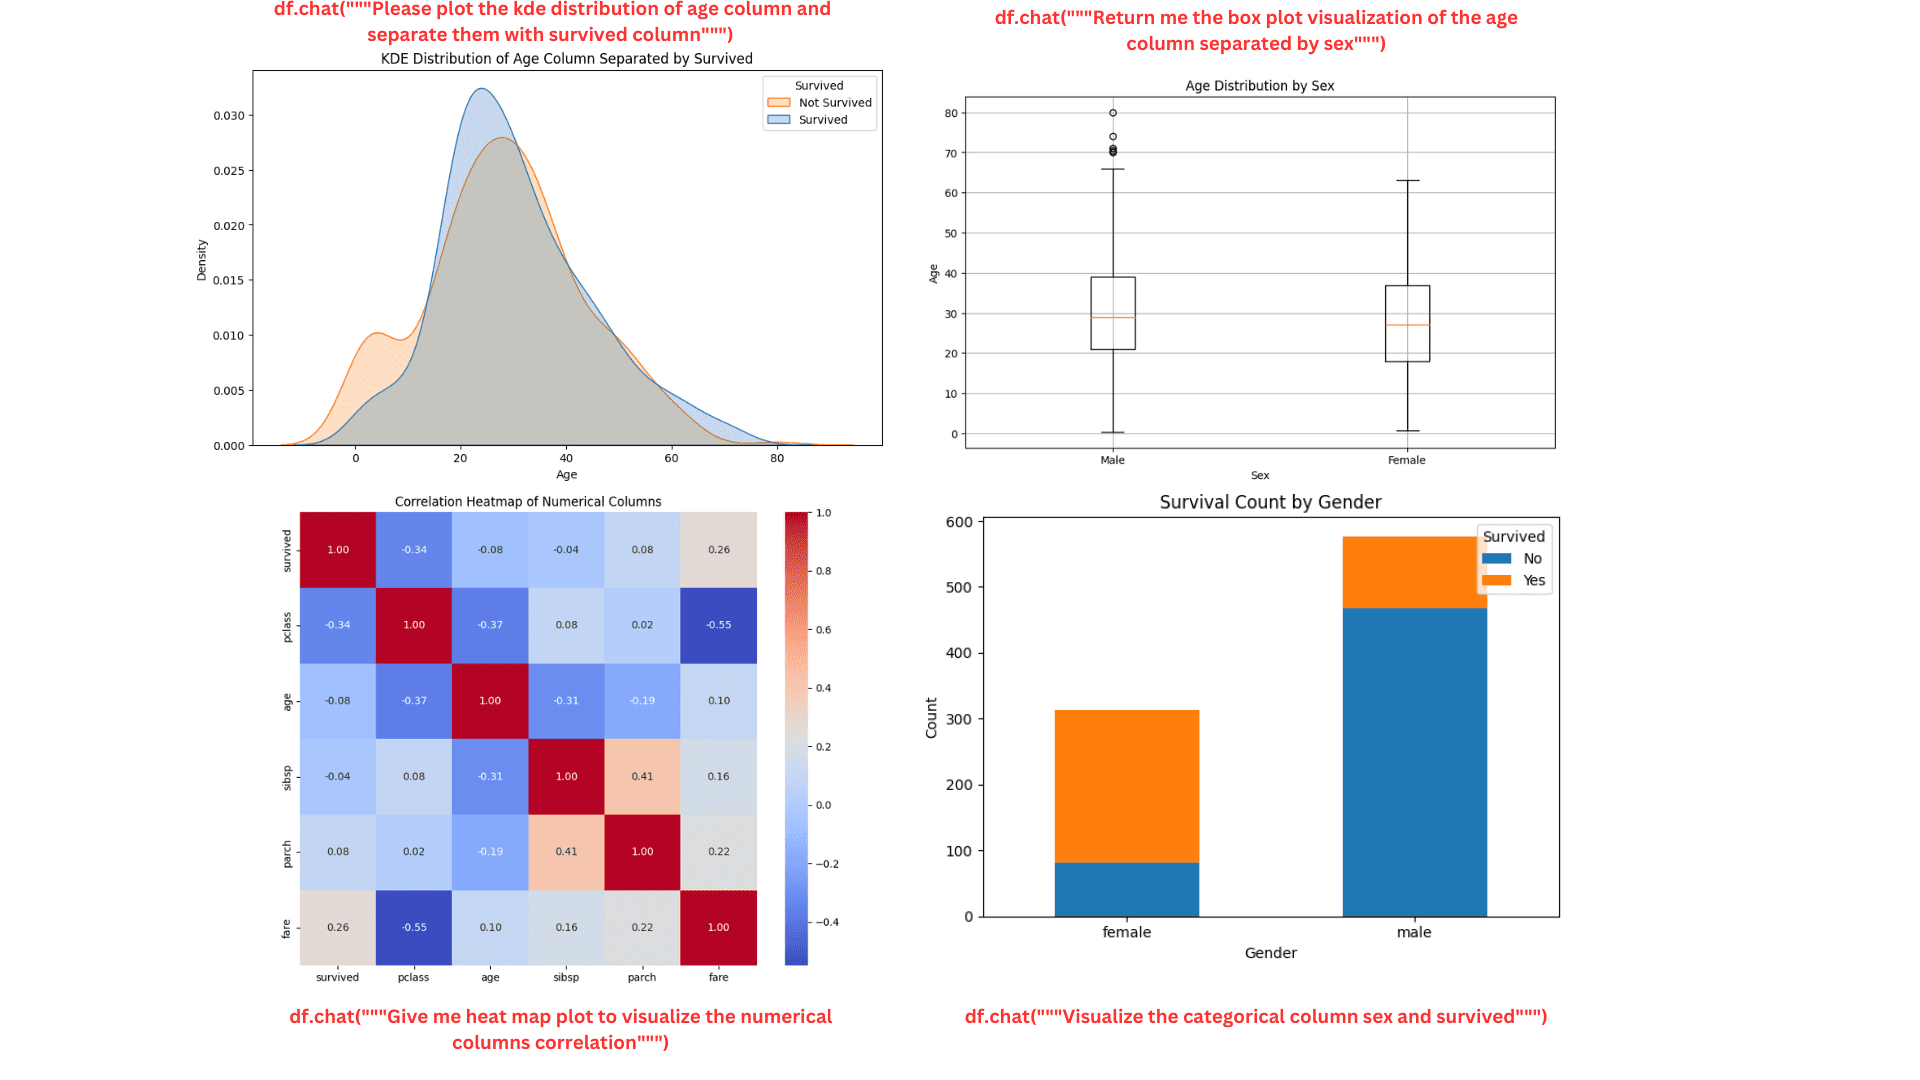
Image by Author
The plot looks nice and neat. You can keep asking the Pandas AI for more details if necessary.
Pandas AI Advances Usage
We can use several in-built APIs from Pandas AI to improve the Pandas AI experience.
Cache clearing
By default, all the prompts and results from the Pandas AI object are stored in the local directory to reduce the processing time and cut the time the Pandas AI needs to call the model.
However, this cache could sometimes make the Pandas AI result irrelevant as they consider the past result. That’s why it’s good practice to clear the cache. You can clear them with the following code.
import pandasai as pai
pai.clear_cache()
You can also turn off the cache at the beginning.
df = SmartDataframe(data, {"enable_cache": False})
In this way, no prompt or result is stored from the beginning.
Custom Head
It’s possible to pass a sample head DataFrame to Pandas AI. It’s helpful if you don’t want to share some private data with the LLM or just want to provide an example to Pandas AI.
To do that, you can use the following code.
from pandasai import SmartDataframe
import pandas as pd

# head df
head_df = data.sample(5)

df = SmartDataframe(data, config={
    "custom_head": head_df,
    'llm': llm
})
Pandas AI Skills and Agents
Pandas AI allows users to pass an example function and execute it with an Agent decision. For example, the function below combines two different DataFrame, and we pass a sample plot function for the Pandas AI agent to execute.
import pandas as pd
from pandasai import Agent
from pandasai.skills import skill

employees_data = {
    "EmployeeID": [1, 2, 3, 4, 5],
    "Name": ["John", "Emma", "Liam", "Olivia", "William"],
    "Department": ["HR", "Sales", "IT", "Marketing", "Finance"],
}

salaries_data = {
    "EmployeeID": [1, 2, 3, 4, 5],
    "Salary": [5000, 6000, 4500, 7000, 5500],
}

employees_df = pd.DataFrame(employees_data)
salaries_df = pd.DataFrame(salaries_data)

# Function doc string to give more context to the model for use of this skill
@skill
def plot_salaries(names: list[str], salaries: list[int]):
    """
    Displays the bar chart  having name on x-axis and salaries on y-axis
    Args:
        names (list[str]): Employees' names
        salaries (list[int]): Salaries
    """
    # plot bars
    import matplotlib.pyplot as plt

    plt.bar(names, salaries)
    plt.xlabel("Employee Name")
    plt.ylabel("Salary")
    plt.title("Employee Salaries")
    plt.xticks(rotation=45)

    # Adding count above for each bar
    for i, salary in enumerate(salaries):
        plt.text(i, salary + 1000, str(salary), ha='center', va='bottom')
    plt.show()


agent = Agent([employees_df, salaries_df], config = {'llm': llm})
agent.add_skills(plot_salaries)

response = agent.chat("Plot the employee salaries against names")
The Agent would decide if they should use the function we assigned to the Pandas AI or not.
Combining Skill and Agent gives you a more controllable result for your DataFrame analysis.
Conclusion
We have learned how easy it is to use Pandas AI to help our data analysis work. Using the power of LLM, we can limit the coding portion of the data analysis works and instead focus on the critical works.
In this article, we have learned how to set up Pandas AI, perform data exploration and visualization with Pandas AI, and advance usage. You can do much more with the package, so visit their documentation to learn further.
Cornellius Yudha Wijaya is a data science assistant manager and data writer. While working full-time at Allianz Indonesia, he loves to share Python and data tips via social media and writing media. Cornellius writes on a variety of AI and machine learning topics.