
Fabric is here but what does that mean if you are using Power BI? What do you need to know and what, if anything, will you need to change if you are a Power BI report designer, developer or BI solution architect? What parts of Fabric should you use now and how do you plan for the near-term future? As I write this in March of 2024, I’m at the Microsoft MVP Summit at the Microsoft campus in Redmond, Washington this week learning about what the product teams will be working on over the next year or so. Fabric is center stage in every conversation and session. To say that Fabric has moved my cheese would be a gross understatement. I’ve been working with data and reporting solutions for about 30 years and have seen many products come and go. Everything I knew about working with databases, data warehouses, transforming and reporting on data has changed recently BUT it doesn’t mean that everyone using Power BI must stop what they are doing and adapt to these changes. The core product is unchanged. Power BI still works as it always has.
The introduction of Microsoft Fabric in various preview releases over the past two years have immersed me into the world of Spark, Python, parquet-Delta storage, lakehouses and medallion data warehouse architectures. These technologies, significantly different from the SQL Server suite of products I’ve known and loved for the past twenty years, represent a major shift in direction, forming the backbone of OneLake; Microsoft’s universal integrated data platform that hosts all the components comprising Fabric. They built Fabric on top of the existing Power BI service, so all of the data workloads live inside familiar workspaces, accessible through the Power BI web-based portal (now called the Fabric portal).
I’m speaking at the Fabric Community Conference (aka “FabCon”) in Las Vegas the week of March 24th on the topic: “Enterprise BI with Power BI and Microsoft Fabric“. I spoke on a similar topic at the PASS Data Community Summit about a year and a half ago in a session titled: “Using Power BI with Lots of Data”. The format of the 2022 session was quite successful so I used it as the basis for the FabCon presentation. The new session introduces Fabric design patterns to well-established Power BI best practices for enterprise-scale analytic reporting solutions.
But, again, what do you need to change now that Fabric has become the grown-up version of Power BI? Just chill… I’m getting there so hold-on while I introduce how Fabric has changed the way we might think about approaching enterprise-scale BI differently than we have in the past.
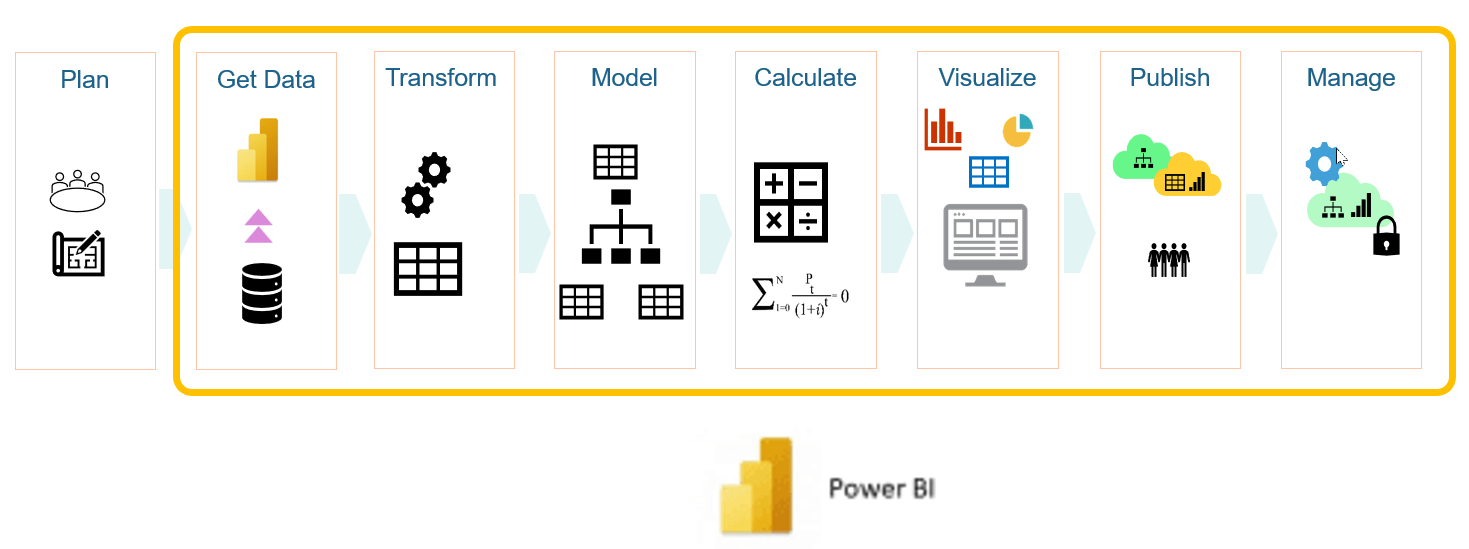
Here’s a brief overview of my FabCon presentation… Power BI solutions consist of numerous development stages and efforts, all performed within Power BI Desktop or the Power BI service. Of note, the data ingestion and transformation stages are all contained within Power BI. I cover various practices and techniques to optimize and then scale a solution that processes these actions and runs entirely within the power BI service.
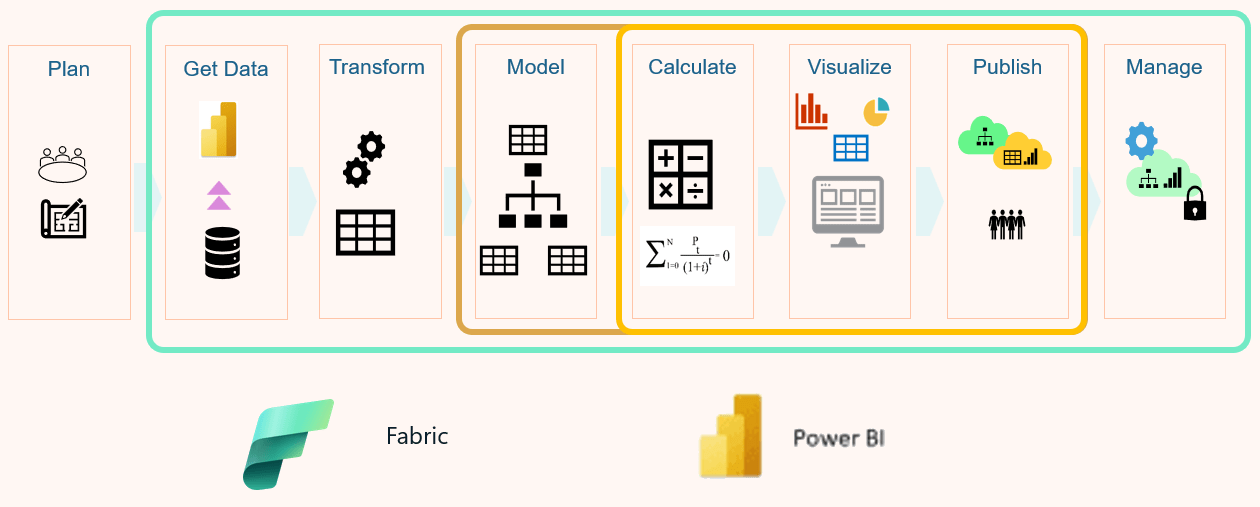
By introducing Fabric, some of the processing can occur outside of Power BI, earlier in the process – in a tightly integrated and managed environment. In this diagram, the data ingestion and transformations occur before the data gets to Power BI. Data shaping and transformation could occur in a Spark notebook or Gen2 dataflow where it is written to a lakehouse. A semantic model is built from the lakehouse structured data storage. The semantic model (that thing we used to call a Power BI “dataset”), in this case, exists both in Fabric and in Power BI. Every Fabric lakehouse has a corresponding semantic model that utilizes the Power BI in-memory analytic engine, so in a sense, the model is both a Fabric and a Power BI asset. The semantic model, report management and user access are managed in Fabric along with everything else using role based Entra security (aka “AAD or Windows security”).
Do you Need to Make Changes?
You don’t NEED to make any changes. Power BI can work exactly as it has in the past. Import mode models continue to function, and DirectQuery mode continues to be supported as it has in the past. But, what CAN you do differently if you want to take advantage of the new and improved goodness offered by the Fabric platform? Let’s dig-in and see how this changes.
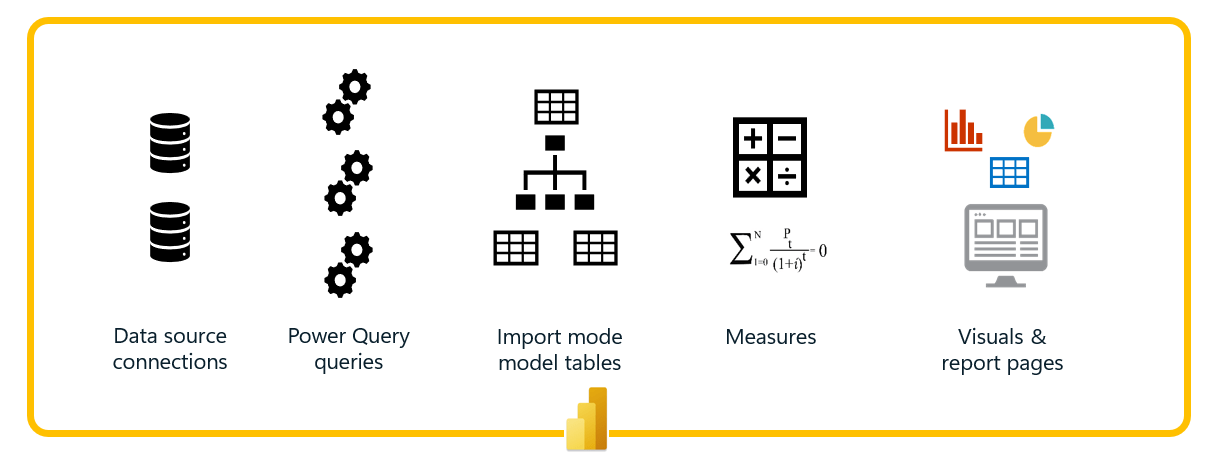
Consider the solution components in the follow diagram encompassing portions of Power BI that we might consider transitioning to Fabric. The source connections enable connectivity from data sources to the Power Query queries that run within our Power BI model. After executing all the transformation steps in these queries, the resulting tables are loaded into an Import-mode data model. Measures in the model perform calculations for the visuals and reports pages on the reports.
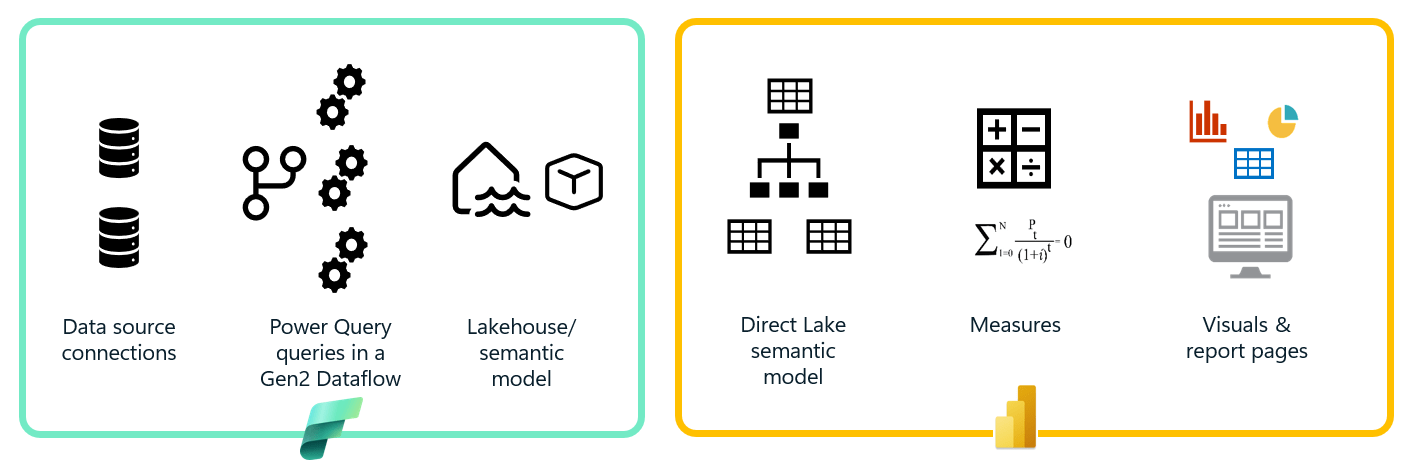
In the Fabric solution, the Power Query queries are moved from Power BI to a Fabric Gen2 Dataflow. Since the new Dataflows in Fabric use the same query structures, language and visual designer as Power BI; little if anything might need to change. If the data sources are the same, queries could literally be copied and pasted from Power BI to the dataflow.
I remember my first reaction to Power Query and the “M” data mashup/transformation language around 2012. I had done quite a lot of work in SQL Server Integration Services and thought that Power Query would be an excellent, modern replacement for SSIS – but unfortunately Power Query was only able to output to an Excel worksheet or Power Pivot/Power BI semantic model table.
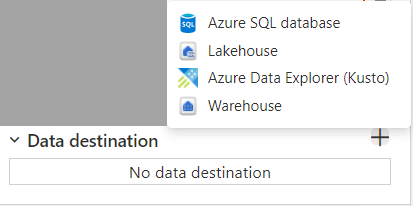
A significant difference between Power Query in Power BI Desktop and Gen2 Dataflows in Fabric is that each query can have a destination. A query can output to an Azure SQL database, a Fabric lakehouse, KQL database or to a Fabric warehouse. A dataflow is backed by the Spark engine through a lakehouse to perform optional staging for query results. This means that Power Query is now a first class ETL tool that can be used in enterprise solutions.
Direct Lake: Is it a Warehouse, a Semantic Model or both?
More about Direct Lake and DirectQuery
Whether you choose to load tables into a Fabric lakehouse or warehouse to house fact and dimension tables, a semantic model is generated over the top of that data schema; and the records in the lakehouse or warehouse are immediately available to the in-memory semantic model.
Wait, what? Let me say that again…
As soon as data is written to the Fabric lakehouse or warehouse, those records are immediately made available in a Power BI semantic model that can be seen in reports. A Direct Lake model reads data directly from the parquet-Delta storage files that the Spark engine uses to manage records in the lakehouse/warehouse, which is also the storage medium for the VertiPaq in-memory column store for the model. This means that, relative to the connectivity between the “source” data warehouse and data model that feeds your report visuals, there is no need for data refresh because there is only one copy of the data. It’s already in the semantic model!
Rather than thinking about Power BI as the consumer of a data warehouse, it becomes an integral part of the data warehouse and analytics solution architecture, performing the data extraction and shaping to load tables in the lakehouse or warehouse, which then becomes the schema definition for the semantic model used for reporting.
In many ways, this new approach is the holy grail for “real-time” analytics that we have been striving for since the early days of SQL Server and Analysis Services. Before you get too excited (and you should – this is cool!) …there are trade-off decisions and some important design considerations before you jump into the deep end of the pool and try to move all your Power BI projects to use this new paradigm. Not everything works as it did with Import and DirectQuery mode, so you’ll have to adjust your approach. I’ll cover the details in another blog post: Direct Lake and DirectQuery in the Age of Fabric (post date TBD).
That’s it for now. Please check back for updates to this post where I will discuss:
Taking Steps to Prepare
In terms of breadth and capability, Fabric has a much larger footprint than Power BI, so “winging it” is simply not an option for a successful outcome. Before you jump-in and start building, it is imperative to have a plan that addresses an organization’s business needs aligned with the technical solution. Involve business stakeholders and make sure the right people have a seat at the table to formulate an adoption plan. This guide from 3Cloud*, titled “How to Activate Microsoft Fabric in Your Organization” concisely covers the important points by outlining organizational readiness, stakeholder involvement and empowering a data-focused team. Having a data governance strategy is essential and often overlooked, especially when running the show without necessary involvement from the right parties. Adoption requires coordinated ownership and participation from executive business leaders and stakeholders, business data owners, information technologist, developers and specialists. Start by measuring your organizational maturity in specific areas to realistically assess your overall readiness, and then plan accordingly. The guide aligns with the Microsoft Fabric Roadmap by assessing organization maturity in five key areas, or pillars:
- Data privacy
- Data quality
- Metadata management
- Data and information architecture
- Program management
Maturity levels can then be categorized generally as:
- 1-Aware
- 2-Reactive
- 3-Proactive
- 4-Champion
- 5-Leader
This not to say that if your organization isn’t in the Leader or Champion category, that you can’t move forward with an enterprise Fabric solution. You should do so with the understanding that there is room to grow. Take baby steps, plan to iterate and use this assessment as a tool to communicate progress across the organization.
*Disclaimer: 3Cloud is my employer.
How to Transition Existing Solutions
Start by assessing your current Power BI solutions and sort them into two different categories: “Self-service” and “Enterprise”. Power BI is an excellent tool for self-service and business user-driven reporting. Reports and models in this category are usually fit-for-purpose and may not be fully governed, or they may yield results that are “semi-trusted” and used with a degree of caution, but still provide important business value within the confines of their scope. Most self-service reports don’t need to grow into full-scale Fabric projects. Enterprise-scale solutions typically use governed data sources and are designed and built on a well-defined set of business requirements. The resulting semantic models and reports are typically promoted as endorsed or certified as accurate and trustworthy sources of business truth. Particularly with data volume and scale, these projects are good candidates for Fabric migration, using assets like warehouses, Direct Lake models, notebooks and Gen2 dataflows.
Building from scratch will generally be easier than trying to migrate an existing solution so assess whether you use Fabric to begin new work or whether you undertake a migration. It might be best to start with the former and then move to the latter.
Migrating a Power BI Desktop-authored project to use Fabric architecture involves the following steps. These are high-level and the detailed steps will be the topic of demos, posts and tooling that is sure to evolve in the community. Watch for an updated post and I’ll walk through this process.
- Establish the model schema in a lakehouse or warehouse. Tables can be defined by the Power Query output as long as names and data types conform to Spark/Parquet-Delta restrictions (e.g. no spaces).
- Move the Power Query queries from Desktop to a new Gen2 dataflow. There isn’t a real convenient out of the box method to do this yet, but you can copy and paste the M code for each query, one at a time and fix-up the source connections.
- For each query, set the destination to a new table in the lakehouse or warehouse.
- Generate a new semantic model from the lakehouse or warehouse. Include each table in the model and don’t use views like we used to do with SQL Server and Power BI. I’ll explore the reasons for this best-practice change in a later post.
- Rename tables and columns in the semantic model using user-friendly naming conventions. Hide key columns, utility columns and numeric columns just like you would in Desktop. Performing these mundane tasks is a lot easier in Tabular Editor since most of it can be done in bulk and without waiting for the model schema to be updated while you work.
- Create measures, hierarchies, display folders, perspectives, calculation groups, etc. in the model. You can script all of these objects with Tabular Editor from the Power BI Desktop model to the new semantic model.
- Connect existing reports to the new semantic model. If all the table, column and measure names are the same, and there are no schema differences, the switch can be plug-n-play. Otherwise, you will need to make some tweaks to the field and object mappings. With Tabular Editor open, you can quickly make model schema changes and save them back to the service without waiting for data refresh.

Hi Paul
Firstly, thank you for this informative article ! It really answered alot of questions I had regarding where my existing Power BI projects fits in with Fabric.
I like the way you explained Power BI’s development stages especially the diagram. It sums it all up nicely
Can I use your diagram in my Youtube video? I’ll acknowledge your article in my video.
Thanks
Fiona
This seems like a whirlpool of hidden cost, Microsoft has been trying to rebrand and repackage things. How will this help Enterprise setup and it completely omits governance.
I respectfully disagree. Fabric is new so of course there loose ends to tie up, but Microsoft have been very transparent with costs and expectations. We’re seeing many large organizations finally getting their act together and taking all aspects of data culture seriously as we work alongside them. Governance is top of the list. Microsoft have published a comprehensive adoption roadmap that spells out organizational adoption from A to Z. Governance is not a product – it’s a mindset and a management approach that works with people and technology tools that work well together.
Good start. Hoping to see more from your research
Power BI Premium $20.00 Per Month Fabric $200.00
No… Power BI Premium is $5,000/month and Fabric starts at ~ $200/month. Power BI Premium per user is $20 per user (…times dozens or hundreds or thousands of users)