What is What-If Analysis in Excel?
If you’re working on an Excel sheet and maintaining multiple parameters, it must be challenging to track all of them simultaneously. Let’s say you have a product and wish to analyze the profit on its sales using different sales prices and units sold. How would you do that? This is precisely where a What-If analysis in Excel can save you a lot of time.
Still confused? Imagine you’re planning a road trip to a famous tourist destination. Naturally, you will consider the distance, fuel consumption, travel, and departure time for various commuting options, budgets, and alternatives. Before finalizing the plan, you will consider different scenarios and see which one suits you best. This is exactly how Excel’s what-if analysis helps in analyzing data.
Table of contents
- What-If Analysis in Excel
- Importance of What-If Analysis in Decision-Making
- Data Analysis Tools in Excel
- Different Types of What-If Analysis In Excel
- Using What-If Analysis for Sensitivity Analysis
- Scenario Analysis with Scenario Manager
- What-If Analysis with Data Tables
- What-If Analysis with Goal Seek
- Advanced What-If Analysis Techniques
- Limitations and Best Practices of What-If Analysis
- Conclusion
- Frequently Asked Questions
What-If Analysis in Excel
As the name suggests, what-if analysis in Excel is simply finding answers to “what happens if we do this.” It is the process of observing or analyzing how changing cell values impacts the result. This powerful feature allows you to explore dynamic scenarios, like changing formulas, etc., and then note how these dependencies impact the worksheet’s outcome.
Importance of What-If Analysis in Decision-Making
Almost every data analyst or expert works with Excel sheets to make better, quicker, and more accurate data decisions. The What-If analysis in Excel is very efficient and widely used in several applications like scenario evaluation, risk assessment, cost-benefit analysis, forecasting, and more. Let’s read about some of them in detail.
Scenario Evaluation
With the what-if analysis in Excel, analysts can input different values as “IFs” and see “What” happens in each scenario. This helps decision-makers to see the potential consequences of different scenarios.
Risk Assessment
Using this analysis, decision-makers can also assess potential risks. For instance, technical people working in oil rigs or anywhere in the oil and gas industry continually use the What-If analysis in Excel to see how different volumes and capacities impact oil and gas production.
Resource Allocation
What-if analysis in Excel can also assist in optimizing resource allocation by analyzing different scenarios. Using this analysis, decision-makers can identify resource requirements, evaluate cost implications, and anticipate investments based on their potential impact.
Forecasting
Analysts and decision-makers can use the various tools available for what-if analysis in Excel to forecast stock prices, future sales, and any other relevant factors.
Data Analysis Tools in Excel
Excel offers numerous tools that you can use for data analysis and gain insights, summarize unorganized data, perform statistical analysis, and much more. In this section, let’s explore some of the most used ones.
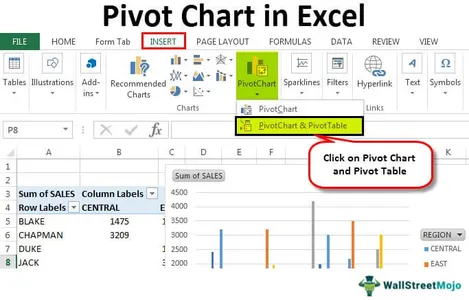
- Pivot Tables: These tables help you summarize and analyze massive datasets by clubbing data based on some criteria. Pivot tables can generate stats and perform exploratory data analysis. Further, they can also be used to create custom reports using a follow-up feature called PivotCharts. Click on Insert > PivotChart > PivotChart and PivotTable to use this tool.
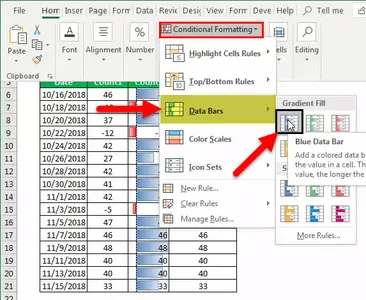
- Conditional Formatting: Formatting per your requirements can save you a lot of time analyzing data. It allows you to handle cells just as you want—you can delete them, hide them, or even highlight them based on the specified condition. It works best for finding outliers, duplicates, and specific patterns. Click on Conditional Formatting > then choose the columns/rows and work.
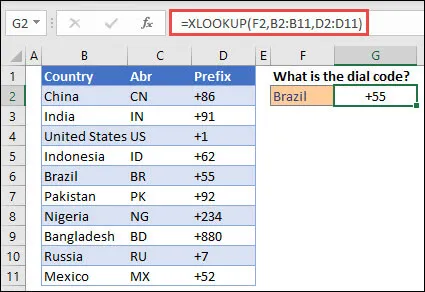
- XLOOKUP: This function combines HLOOKUP and VLOOKUP, extending the lookup feature vertically and horizontally. Once you have mentioned a range, using XLOOKUP, you can find or “look up” the values within the range. Use the following command =XLOOKUP(‘value’ , ‘range’).
Different Types of What-If Analysis In Excel
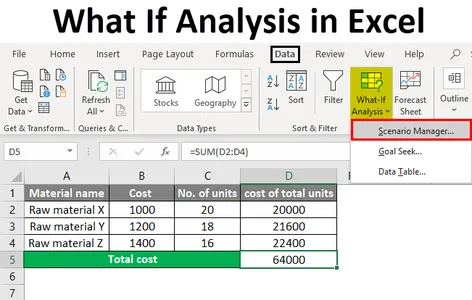
There are three main kinds of what-if analysis in Excel: Scenario, Goal Seek, and Data Tables.
- Scenario What-If Analysis: As per Excel terminology, a ‘scenario’ is a set of values that a worksheet saves and can automatically substitute in the cells. You can tailor different groups in a worksheet and then switch to any scenario you created previously.
- Goal Seek What-If Analysis: Goal seek allows you to find the input value needed to achieve a specific target or goal for a calculated result. Using this type of what-if analysis in Excel, you can perform reverse computations and find the desired input level.
- Data Tables What-If Analysis: Data tables allow you to calculate multiple values based on different inputs. They help explore various scenarios and understand the impact of changing variables.
Using What-If Analysis for Sensitivity Analysis
The What-If analysis in Excel is also widely used in sensitivity analysis. Here’s how it is done.
Conducting Sensitivity Analysis in Excel
- Set up your Excel sheet and consider different scenarios before identifying the cells you wish to include.
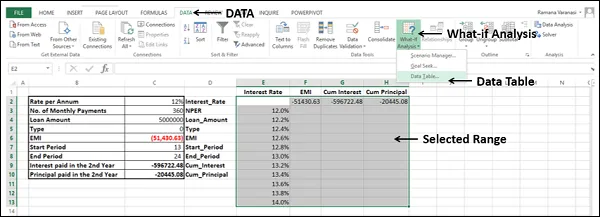
- Head to the
- In the dialog box, enter the cells (rows and columns) you wish to analyze. Enter a range of values for the input variable(s).
- Click OK to generate a table corresponding to your inputs.
- Analyze the data table results to understand your model’s sensitivity.
Assessing the Impact of Changing Variables
By observing the sensitivity table, you can see how changing values impact the calculated results. You can use this information to make more informed decisions, identify areas of risk or uncertainty, and prioritize your focus on the most influential variables.
Scenario Analysis with Scenario Manager
This section discusses the scenario what-if analysis in Excel.
Integrating Scenarios with Scenario Manager
Scenario Manager is a robust Excel tool widely used for what-if analysis. It allows you to create and handle several scenarios to see how changing variables impact your worksheet. Primarily, it compares multiple sets of input values to observe different outcomes.
- Set up your Excel sheet and consider different scenarios before identifying the cells you wish to include.
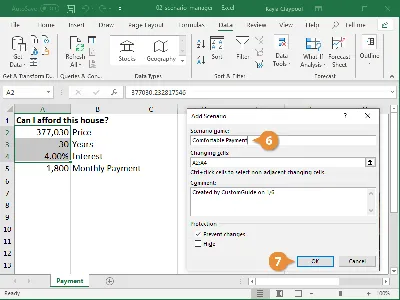
- Head to the “Data” tab and click on “What-If Analysis” > “Scenario Manager.”
- In the Add Scenario dialog box, provide a name for your scenario to identify it quickly.
- Select the desired cells and enter the new values.
- Do the same for multiple scenarios by “Adding.”
- Once you have created all the desired scenarios, you can easily switch between them.
Analyzing Different Scenarios
Scenario Managers lets you generate a summary for each scenario. You can also generate a report or display the results visually in a separate worksheet.
What-If Analysis with Data Tables
Data tables are one of the most systematic ways to calculate results based on different combinations of inputs. Here’s how it is done.
Using Data Tables for What-If Analysis
- Set up your Excel sheet and consider different scenarios before identifying the cells you wish to include.
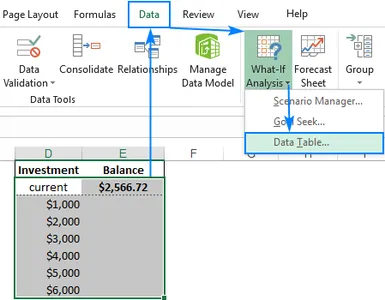
- Head to the “Data” tab and click on “What-If Analysis” > “Data Tables.”
- In the dialog box, enter the cells (rows and columns) you wish to analyze. Enter a range of values for the input variable(s).
- Click OK to generate a table corresponding to your inputs.
- Analyze the results.
Creating and Interpreting Data Tables
Utilizing Data Tables for What-If Analysis allows you to quickly produce different results by changing the input values. This enables you to investigate many situations, evaluate your model, and base your judgments on the outcomes.
What-If Analysis with Goal Seek
Let’s move on to see how Goal Seek works.
Applying Goal Seek for What-If Analysis
With Excel’s proficient Goal Seek tool, you can perform What-If Analysis by determining the input value required to reach a particular target or goal for a calculated result.
Setting Up Goal Seek Analysis
- Set up your Excel sheet and consider different scenarios before identifying the cells you wish to include.
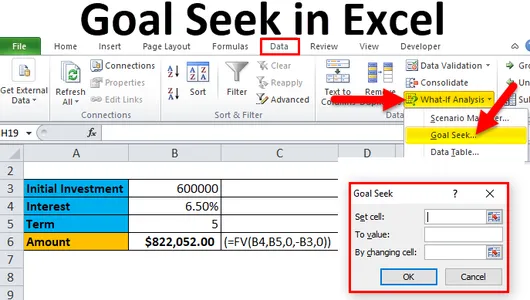
- Head to the “Data” tab and click on “What-If Analysis” > “Goal Seek.”
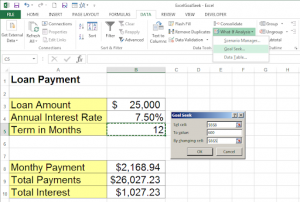
- In the Goal Seek dialog box that appears, you’ll see three input fields:
- “Set Cell”: output cell that contains the calculated result. Excel will adjust the value in this cell.
- “To value”: Enter the target value you want to achieve.
- “By changing cell”: Select the input cell you want to adjust to reach the target value.
- Once you’ve entered the inputs, click OK to command Excel to perform the goal seek calculation.
- You will get a display message whether a solution was found or not. If a solution is found, the adjusted value for the input cell will be displayed.
Using Goal Seek to Find Desired Results
To determine how the modified input value affected the calculated result, analyze the results. You can also evaluate the viability of the Goal Seek solution.
Advanced What-If Analysis Techniques
In addition to the standard data analysis techniques, Excel also offers many advanced what-if analysis tools, like Solver, A/B Testing, Agent-based Modeling, and more. Here, we’re focusing on how Solver is used for complex what-if analyses.
Using Solver For Complex Scenarios
Solver is a powerful Excel tool commonly used for mathematical modeling, optimization, and constraint analysis. Here’s how you can use Solver in Excel for complex scenarios.
- Enable the Solver add-in. Go to “File” > “Options” > “Add-ins.”
- Define the problem. Whether it is maximization, minimization, etc.
- Determine the constraints or limitations that need to be satisfied.
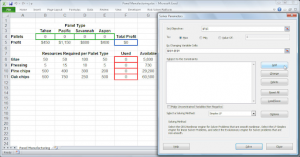
- Once you have defined the problem, go to the “Data” tab and click on the “Solver” button in the “Analysis” group.
- In the Solver Parameters dialog box, set the parameters. Specify the objective cell, decision variables, and cells having constraints.
- Click on “Solve” to start the process. Solver will try different combinations of values for the decision variables to find the optimal solution.
Incorporating Multiple Variables in What-If Analysis
Performing a what-if analysis in Excel with more than two variables works best using Scenarios. A scenario can have as many as 32 different values, and you can always create multiple scenarios. Here, an IF condition can have other IF conditions contained in it. These can simultaneously test multiple scenarios and return different results for each.
Contrasting it with Data Tables and Goal Seek, the former works best with one or two variables, and the latter will only perform with one variable.
Limitations and Best Practices of What-If Analysis
Despite how beneficial a what-if analysis is, a few drawbacks and limitations restrict them. For starters, if you frequently work with worksheets, you know that worksheets do fail—and they fail a lot of times. Besides, there are a few other limitations; read on.
Understanding the Limitations of What-If Analysis
- Non-intuitive: Generally, a what-if statement or logic is based on intuitions. You rely on your intuition and see how things turn out. But with spreadsheets, this analysis is non-intuitive. Whether you use goal seek or scenarios, your analysis will only succeed if your data is precise and your problem is straightforward.
- Specifying Cell References is Cumbersome: To set up a what-if analysis for success, you’ll need to be very precise while specifying cells, constraints, control variables, and other parameters. A tiny bit here and there, and your analysis could be inaccurate.
- The Analysis is Only the First Step: Once you’re through with the analysis, you need to visualize the results. On the one hand, spreadsheets allow you to perform the what-if analysis quickly. However, on the other hand, it’ll ask you to generate not one but multiple visualizations to make some sense of the data.
Following Best Practices for Accurate Analysis
Despite the abovementioned limitations, you can still use Excel’s what-if analysis. Follow the practices below to maintain data integrity, minimize errors, and improve the reliability of your results.
- Be precise when you define your objects. Understand the questions you are trying to answer or the problems you are trying to solve.
- Ensure you gather high-quality, reliable, and relevant data for your analysis.
- Document your analysis—the methodology, sources, benchmarks, and everything.
- Use appropriate tools and techniques. Familiarize yourself with the capabilities and limitations of the chosen tools, ensuring they align with your objectives.
Conclusion
Wrapping up, you can see that what-if analysis in Excel is very efficient in empowering analysts and decision-makers to explore scenarios, assess risks, allocate resources, and do much more. By incorporating multiple variables and using advanced techniques such as Solver, data tables, and scenario analysis, Excel enables users to gain valuable insights. Once you define the problem, set up all the constraints, and specify the suitable cells, you’ll get the most out of your what-if analysis in a few seconds.
To learn more about the same, you can look at some tutorials and blogs on Analytics Vidhya. It is a leading platform for data science, machine learning, and artificial intelligence and can be a valuable resource in leveraging what-if analysis and enhancing analytical capabilities.
Frequently Asked Questions
A. The IF function holds a particular purpose. It is used to make logical comparisons and see how the outcome differs from what you expect.
A. What-if Analyses are called sensitivity analyses because they help you determine how sensitive the outcome is to changing variables.
A. The IFS function sees whether multiple IF conditions are met simultaneously, and a value corresponding to the initial TRUE condition is returned.
A. What-if analysis in Excel can be used for cost-minimization, cost-effectiveness, cost-utility, risk assessment, etc.


