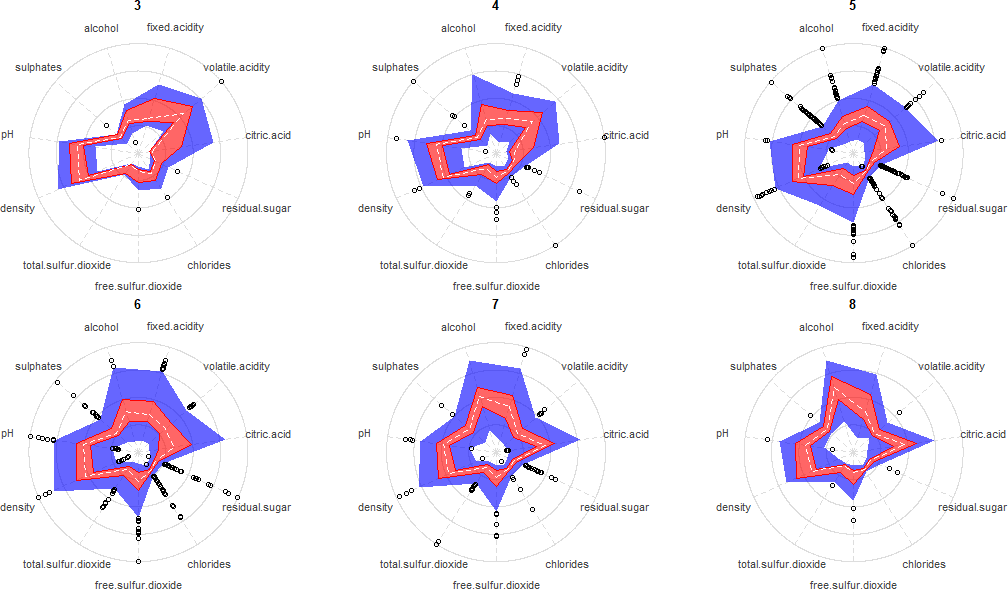
The Radar Box Plot is a visualisation developed by Caio Hamamura, which combines the Radar Chart with the Box Plot. This combination enables the comparison of multivariate data across multiple classes or clusters simultaneously. This visualisation uses radar polygons that can be compared based on their shape and thickness, providing insights into data variability and similarities among classes or clusters.
Analysing a Radar Box Plot can allow for predicting any classification confusion that may arise among classes and help in identifying strategies for improvement. This visualisation is most effective when dealing with tasks involving more than four relevant variables, as it can represent higher-dimensional data in a way that is still legible.
Tools to generate this chart:
Python
R
Examples
Wine Quality
radarBoxplot-R on Github — Caio Hamamura