Recently, I launched an eBook guide on using the built-in Graph Tools in Adobe Illustrator.
From this eBook you can learn to master the Graph Tools for infographic and data visualization work through step-by-step tutorials and working exercises.
The eBook also teaches you all the advanced techniques not normally thought capable on Adobe Illustrator, like combining two chart types together or adding code to bits of text to program in value labels.
The eBook also contains tricks to exploit the Graph Tools to product additional charts, such as Slopegraphs and Bar Code Plots, which are not normally available with the built-in Graph Tools.
There’s also a section on how to make charts responsive for the web, by using the ai2html plugin.
Much of the content for this eBook came from the course manuals I wrote for the Become a Dataviz Pro on Adobe Illustrator and Mastering Graphs for Adobe Illustrator Pros professional training courses that I offer.
However, I can understand that live online training isn’t for everyone. So instead I’ve provided a section of the courses can people can go through in their own time at a fraction of the cost.
Why would I use Illustrator to draw charts when there are better tools out there?
While it’s true that there are many more powerful and advanced tools out there for creating pieces of data visualization, they’re not for everybody. Some require coding skills, while others require training.
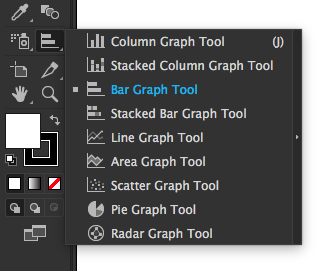
The guide I created is more for those who already know how to use Adobe Illustrator, but they don’t know how to fully utilise the Graph Tools for their,
You can use other tools like Excel and copy + paste them in. However, sometimes the charts are not completely transferred over or corrupted and there’s some tweaking involved. If you know how to use the Graph Tools properly, it’s faster to use them to create the charts inside Illustrator instead.
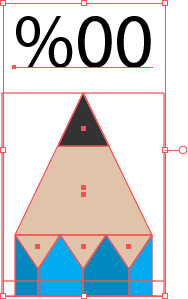
Adobe Illustrator is also great for creating custom charts, as it gives you full control over the visual aspects of a chart’s design.
Where can I get a copy?
You can purchase a copy on the store here. The eBook contents are also displayed there.
The eBook comes in both PDF and EPUB format, is 37 pages long, and fully illustrated with instructional screenshots.