Sentiment Analysis on Flipkart Dataset
This article was published as a part of the Data Science Blogathon.
Introduction
Sentiment Analysis is key to determining the emotion of the reviews given by the customer. Sentiment analysis is mainly used in e-commerce platforms or any platform which requires customer opinion to make people express their experience of that product or a thing. Here, I will be demonstrating sentiment analysis on Flipkart Dataset.
Flipkart is one of the leading e-commerce companies/platforms based in India, which currently competes with Snapdeal, Myntra, Nykaa, and IndiaMART. Since the world is digitizing rapidly, e-commerce platforms are booming and making the best way possible to make and provide their services to the people.
The sentiment analysis of the product reviews is a way that can open ways to understand the performance of the products, which is beneficial for both future customers and the e-commerce platform. The e-commerce company can improve its product and customer services with the sentiment analysis technique. Sentiment analysis can also help the company better understand the product and plan further regarding products.

Importing Libraries
The practical is done using Python language and implementation in Google colaboratory notebook.
To begin with, first, we need to import libraries, which are:
- Pandas: data processing for CSV files (for example: pd.read_csv)
- Seaborn: visualizing statistical plots
- Matplotlib: plotting graphs
- NLTK: Natural Language Processing Toolkit library for NLP task
- WordCloud: used for text data visualization. Bigger font means that a particular word is frequently used.
- A regular expression (re): RegEx, used for pattern matching to better understand the product reviews.
- nltk sentiment Vader: for sentiment analysis purposes, sensitive to polarity (positive, negative, and neutral) and intensity (emotion strength).
- Stopwords: known as commonly used words like a, an, the, it, etc.
Python Code:
About Dataset of Sentiment Analysis
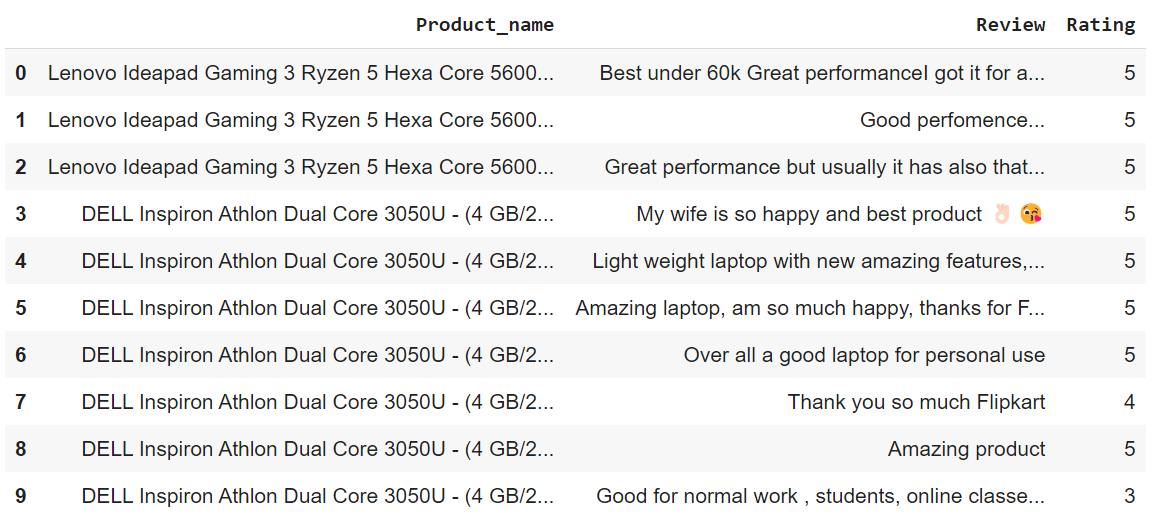
The dataset consists of reviews of the products which customers purchased from Flipkart. The reviews given are the experience about the product customer bought through Flipkart and given a rating to that product.
The dataset for Flipkart contains 3 columns:
- Product_name: the name of the product with little details about it.
- Review: review what the customer gives about that product.
- Rating: ranges from 1 to 5 stars given by the customer.
data = pd.read_csv("/content/flipkart_reviews.csv")
data.head(10)
Checking Null Values
Null values can affect the overall shape of the dataset, which can affect the sentiment analysis too. We need to check whether the dataset contains null values or not. To do so,
data.isnull().sum()
The sentiment analysis task begins if the dataset does not have any null values. We must clean and prepare the reviews column for sentiment analysis to proceed further.
Data Cleaning in Sentiment Analysis
The data cleaning of the review column is done with the use of the regular expression, stemming, and stopwords. Here, stemmar is simply stemming, which converts the words into their root form. To put simple stemming reduces a word into its base form in a way that similar words lie under the same roof, which helps s algorithm understand the text data better (for example, swim, swims, and swimming is reduced to swim, here, the word swim is the root form). SnowballStemmar is a stemming algorithm that works on top of Porter Stemmar. And the use of the regular expression is used to check whether a string contains a specific search pattern.
stemmer = nltk.SnowballStemmer("english")
stopword=set(stopwords.words('english'))
def clean(text):
    text = str(text).lower()
    text = re.sub('[.*?]', '', text)
    text = re.sub('https?://S+|www.S+', '', text)
    text = re.sub('+', '', text)
    text = re.sub('[%s]' % re.escape(string.punctuation), '', text)
    text = re.sub('n', '', text)
    text = re.sub('w*dw*', '', text)
    text = [word for word in text.split(' ') if word not in stopword]
    text=" ".join(text)
    text = [stemmer.stem(word) for word in text.split(' ')]
    text=" ".join(text)
    return text
data["Review"] = data["Review"].apply(clean)
After cleaning the data, we need to see how most people rate the products they purchase from Flipkart. The rating range begins from 1 to 5.
ratings = data["Rating"].value_counts()
numbers = ratings.index
quantity = ratings.values
After counting the total counts of each rating, we can move further to plot the ratings in the form of a pie chart to give us a visual representation and proportion of each rating category.
figure = px.pie(data, values=quantity, names=numbers,hole = 0.5)
figure.show()
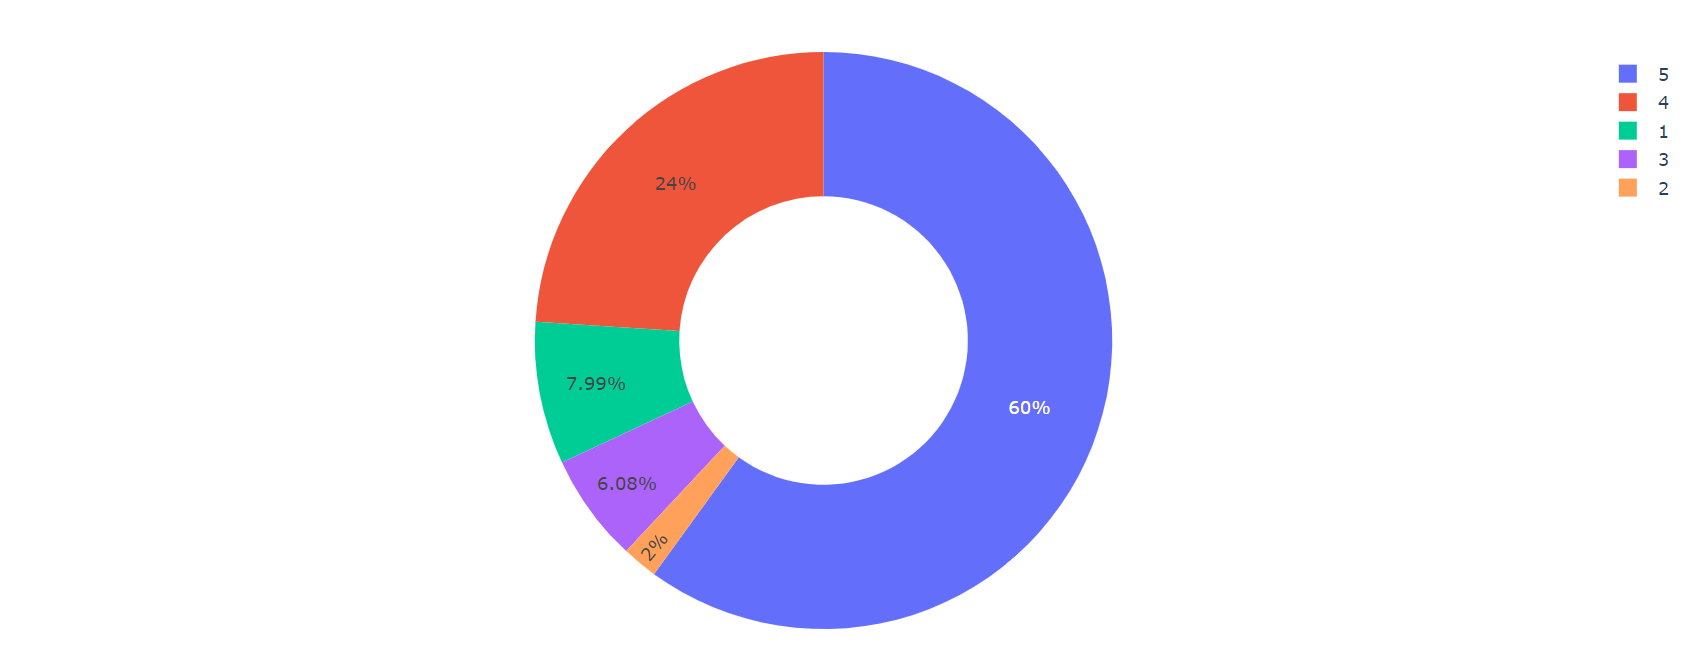
Product reviews rating
So the pie chart depicts that 60% of the people have given 5 out of 5-star ratings to the products they bought from Flipkart, and a 2-star rating is the least given by the customers.
WordCloud
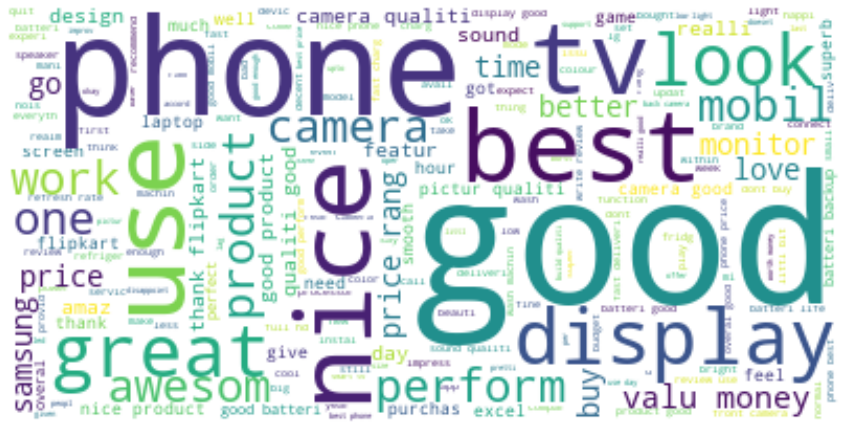
Now let us view the most common or frequent words used by customers to give a product review. To demonstrate that, I have used Wordcloud to visualize the most frequently used words in a bigger font. This is used for the reviews column. WordCloud visualizes the data in a textual representation.
In WordCloud, the most frequently used words or important words will be depicted in large font sizes, and the less frequently used words will have a smaller font size. The below code out output shows that the words like good, phone, and best are used most frequently, so their font size is larger, and words like design, camera, etc. appear in small font sizes.
text = " ".join(i for i in data.Review)
stopwords = set(STOPWORDS)
wordcloud = WordCloud(stopwords=stopwords,
                      background_color="white").generate(text)
plt.figure( figsize=(15,10))
plt.imshow(wordcloud, interpolation='bilinear')
plt.axis("off")
plt.show()
WordCloud visualization
Sentiment Analysis
Here, for sentiment analysis, we will calculate each review’s sentiment score. With this help, we can see what that review actually means, and it can help a future customer who is willing to purchase that product as well as the company to understand that product.
1. Adding columns
To begin, I will add 3 columns to the dataset, which are Positive, Negative, and Neutral, which will calculate the sentiment scores of each review. And this will print and run through all the rows of the dataset. The below code will analyze only the Review column and present each row’s sentiment score. SentimentIntensityAnalyzer() will look at the text and discover whether the piece of given text review is Positive, Negative, or Neutral. Also, the sentiment score will be decided based on the polarity score that determines under what category the review comes.
sentiments = SentimentIntensityAnalyzer()
data["Positive"] = [sentiments.polarity_scores(i)["pos"] for i in data["Review"]]
data["Negative"] = [sentiments.polarity_scores(i)["neg"] for i in data["Review"]]
data["Neutral"] = [sentiments.polarity_scores(i)["neu"] for i in data["Review"]]
data = data[["Review", "Positive", "Negative", "Neutral"]]
data.head()
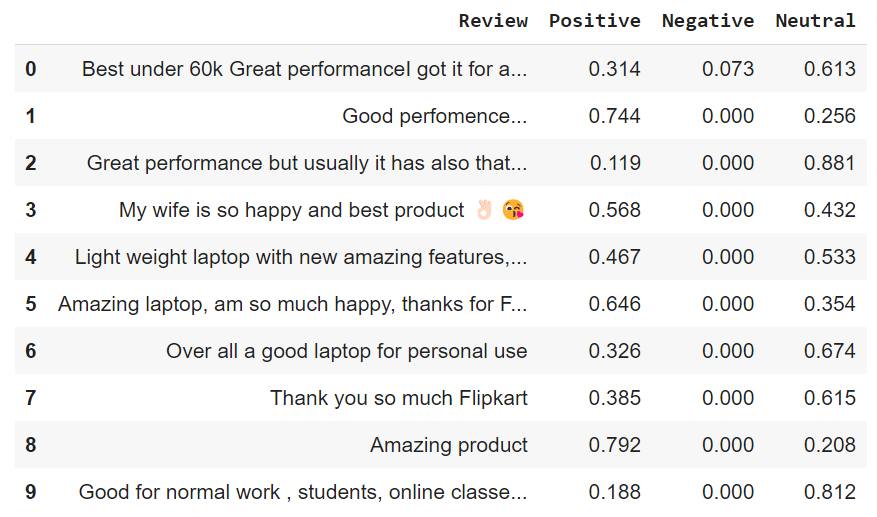
The above output will represent the sentiment score of each row.
2. Reviews for the products
After making the columns, let us see what most of the reviewers think about the products and services they purchased from Flipkart. To do so, I will sum up all the Positive, Negative, and Neutral reviews and then execute an If and Elif conditional block to determine the overall sentiment score of the entire dataset.
x = sum(data["Positive"])
y = sum(data["Negative"])
z = sum(data["Neutral"])
def sentiment_score(a, b, c):
    if (a>b) and (a>c):
        print("Positive 😊 ")
    elif (b>a) and (b>c):
        print("Negative 😠 ")
    else:
        print("Neutral 🙂 ")
sentiment_score(x, y, z)
3. Sentiment state
After executing the above row, the output produced shows that most reviews are in a neutral state. Now to move further, let us calculate the sentiment scores of individual reviews category Positive, Negative, and Neutral.

4. Sentiment scores
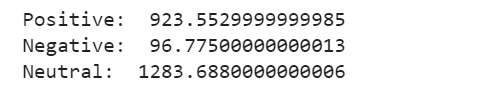
Now let us bifurcate and print the sentiment score of Positive, Negative, and Neutral reviews to know the exact numbers of reviews in each category. The below code will print the total number of reviews of each category: Positive, Negative, and Neutral.
print("Positive: ", x)
print("Negative: ", y)
print("Neutral: ", z)
Conclusion
So, by the above output, there are 923.55 Positive reviews, 96.77 Negative reviews, and 1283.68 Neutral reviews. With the final output of the entire implementation, the key takeaways can be stated as follows:
- Most of the reviews are in favor of Neutral.
- The Negative review score has a small proportion, and Positive reviews are midway.
- So with the help of the above sentiment analysis implementation, we can conclude that most people are satisfied with the products and services they received from Flipkart.
- This states that sentiment analysis is a good process to gather insights into each product, which ultimately benefit present and future customers and e-commerce companies.
- Sentiment analysis is important because, based on bad reviews, the e-commerce company makes those products better or replaces those products with better and newer ones, which ultimately improves the overall customer service too.
The media shown in this article is not owned by Analytics Vidhya and is used at the Author’s discretion.


