Hands-On with Unsupervised Learning: K-Means Clustering
This tutorial provides hands-on experience with the key concepts and implementation of K-Means clustering, a popular unsupervised learning algorithm, for customer segmentation and targeted advertising applications.
Image by Author
K-Means clustering is one of the most commonly used unsupervised learning algorithms in data science. It is used to automatically segment datasets into clusters or groups based on similarities between data points.
In this short tutorial, we will learn how the K-Means clustering algorithm works and apply it to real data using scikit-learn. Additionally, we will visualize the results to understand the data distribution.
What is K-Means Clustering?
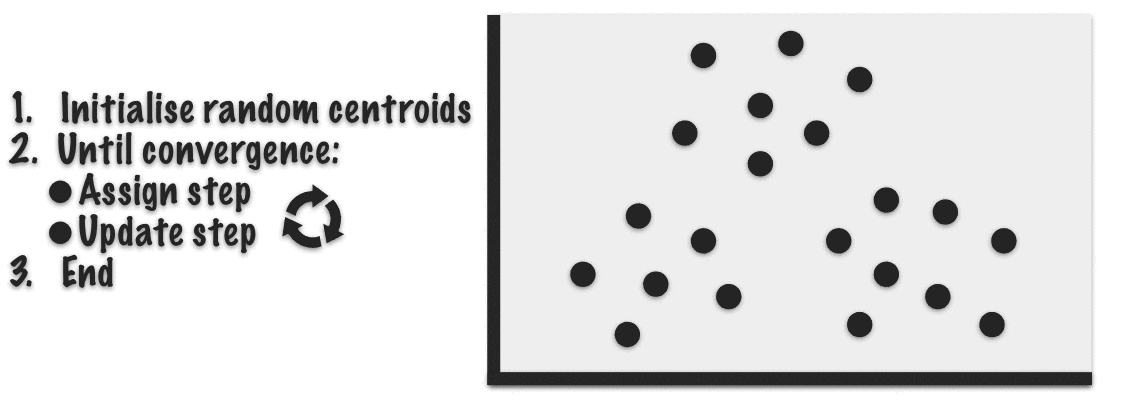
K-Means clustering is an unsupervised machine learning algorithm that is used to solve clustering problems. The goal of this algorithm is to find groups or clusters in the data, with the number of clusters represented by the variable K.
The K-Means algorithm works as follows:
- Specify the number of clusters K that you want the data to be grouped into.
- Randomly initialize K cluster centers or centroids. This can be done by randomly picking K data points to be the initial centroids.
- Assign each data point to the closest cluster centroid based on Euclidean distance. The data points closest to a given centroid are considered part of that cluster.
- Recompute the cluster centroids by taking the mean of all data points assigned to that cluster.
- Repeat steps 3 and 4 until the centroids stop moving or the iterations reach a specified limit. This is done when the algorithm has converged.
Gif by Alan Jeffares
The objective of K-Means is to minimize the sum of squared distances between data points and their assigned cluster centroid. This is achieved by iteratively reassigning data points to the closest centroid and moving the centroids to the center of their assigned points, resulting in more compact and separated clusters.
K-Means Clustering Real-World Example
In these examples, we will use Mall Customer Segmentation data from Kaggle and apply the K-Means algorithm. We will also find the optimum number of K (clusters) using the Elbow method and visualize the clusters.
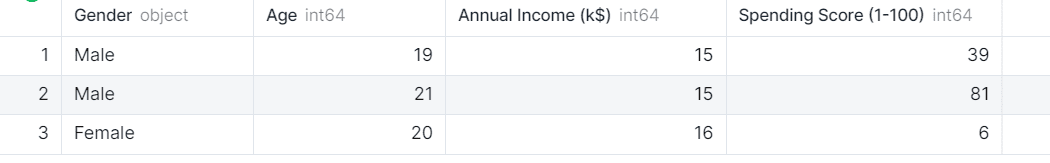
Data Loading
We will load a CSV file using pandas and make “CustomerID” as an index.
import pandas as pd

df_mall = pd.read_csv("Mall_Customers.csv",index_col="CustomerID")
df_mall.head(3)
The data set has 4 columns and we are interested in only three: Age, Annual Income, and Spending Score of the customers.
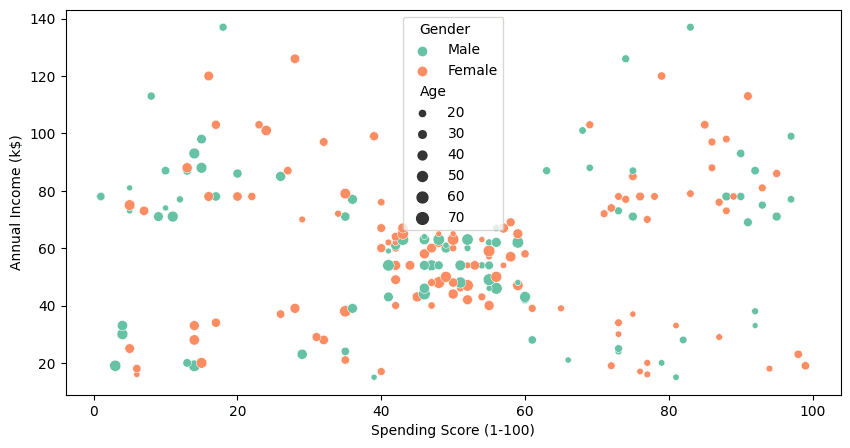
Visualization
To visualize all four columns, we will use seaborn’s `scatterplot` .
import matplotlib.pyplot as plt
import seaborn as sns

plt.figure(1 , figsize = (10 , 5) )
sns.scatterplot(
    data=df_mall,
    x="Spending Score (1-100)",
    y="Annual Income (k$)",
    hue="Gender",
    size="Age",
    palette="Set2"
);
Even without K-Means clustering, we can clearly see the cluster in between 40-60 spending score and 40k to 70k annual income. To find more clusters, we will use the clustering algorithm in the next part.
Normalizing
Before applying a clustering algorithm, it's crucial to normalize the data to eliminate any outliers or anomalies. We are dropping the “Gender” and “Age” columns and will be using the rest of them to find the clusters.
from sklearn import preprocessing

X = df_mall.drop(["Gender","Age"],axis=1)
X_norm = preprocessing.normalize(X)
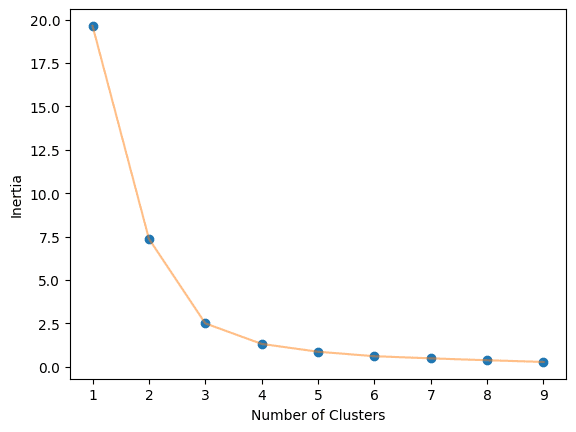
Elbow Method
The optimal value of K in the K-Means algorithm can be found using the Elbow method. This involves finding the inertia value of every K number of clusters from 1-10 and visualizing it.
import numpy as np
from sklearn.cluster import KMeans


def elbow_plot(data,clusters):
    inertia = []
    for n in range(1, clusters):
        algorithm = KMeans(
            n_clusters=n,
            init="k-means++",
            random_state=125,
        )
        algorithm.fit(data)
        inertia.append(algorithm.inertia_)
    # Plot
    plt.plot(np.arange(1 , clusters) , inertia , 'o')
    plt.plot(np.arange(1 , clusters) , inertia , '-' , alpha = 0.5)
    plt.xlabel('Number of Clusters') , plt.ylabel('Inertia')
    plt.show();

elbow_plot(X_norm,10)
We obtained an optimal value of 3.
KMeans Clustering
We will now use KMeans algorithm from scikit-learn and provide it the K value. After that we will fit it on our training dataset and get cluster labels.
algorithm = KMeans(n_clusters=3, init="k-means++", random_state=125)
algorithm.fit(X_norm)
labels = algorithm.labels_
We can use scatterplot to visualize the three clusters.
sns.scatterplot(data = X, x = 'Spending Score (1-100)', y = 'Annual Income (k$)', hue = labels, palette="Set2");
- “0”: From high spender with low annual income.
- “1”: Average to high spender with medium to high annual income.
- “2”: From Low spender with High annual income.
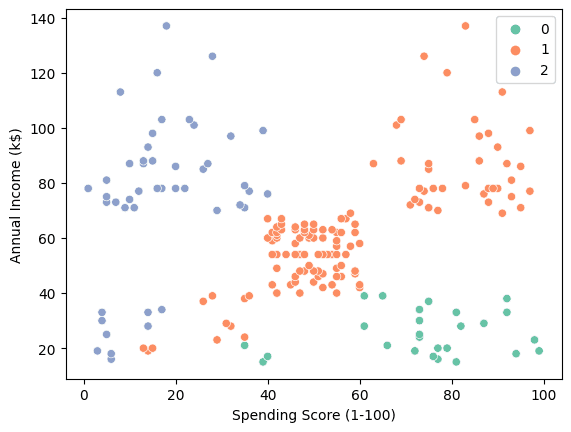
This insight can be used to create personalized ads, increasing customer loyalty and boosting revenue.
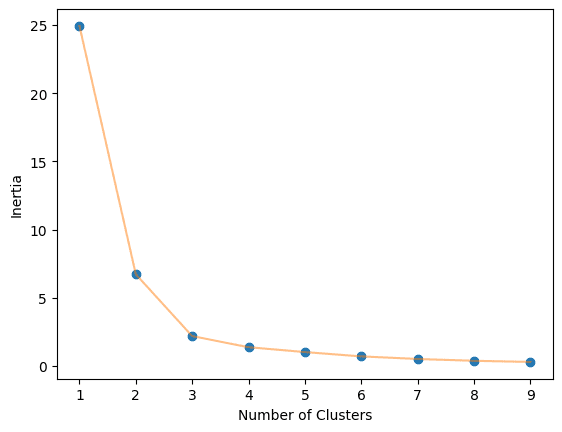
Using different features
Now, we will use Age and Spending Score as the feature for the clustering algorithm. It will give us a complete picture of customer distribution. We will repeat the process of normalizing the data.
X = df_mall.drop(["Gender","Annual Income (k$)"],axis=1)

X_norm = preprocessing.normalize(X)
Calculate the optimal number of clusters.
elbow_plot(X_norm,10)
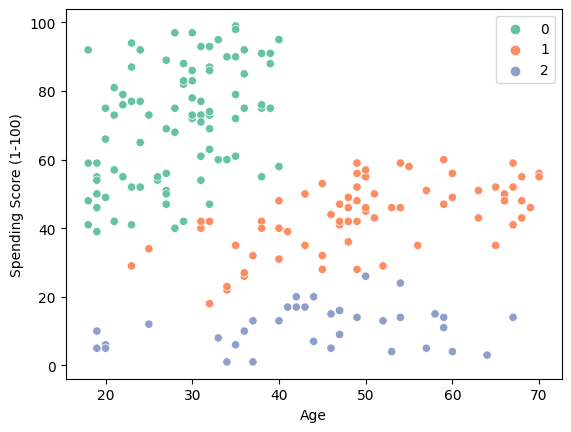
Train the K-Means algorithm on K=3 clusters.
algorithm = KMeans(n_clusters=3, init="k-means++", random_state=125)
algorithm.fit(X_norm)
labels = algorithm.labels_
Use a scatter plot to visualize the three clusters.
sns.scatterplot(data = X, x = 'Age', y = 'Spending Score (1-100)', hue = labels, palette="Set2");
- “0”: Young High spender.
- “1”: Medium spender from middle age to old ages.
- “2”: Low spenders.
The result suggests that companies can increase profits by targeting individuals aged 20-40 with disposable income.
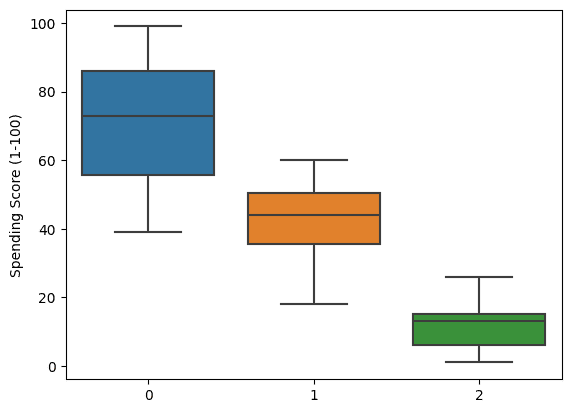
We can even go deep by visualizing the boxplot of spending scores. It clearly shows that the clusters are formed based on spending habits.
sns.boxplot(x = labels, y = X['Spending Score (1-100)']);
Conclusion
In this K-Means clustering tutorial, we explored how the K-Means algorithm can be applied for customer segmentation to enable targeted advertising. Though K-Means is not a perfect, catch-all clustering algorithm, it provides a simple and effective approach for many real-world use cases.
By walking through the K-Means workflow and implementing it in Python, we gained insight into how the algorithm functions to partition data into distinct clusters. We learned techniques like finding the optimal number of clusters with the elbow method and visualizing the clustered data.
While scikit-learn provides many other clustering algorithms, K-Means stands out for its speed, scalability, and ease of interpretation.
Abid Ali Awan (@1abidaliawan) is a certified data scientist professional who loves building machine learning models. Currently, he is focusing on content creation and writing technical blogs on machine learning and data science technologies. Abid holds a Master's degree in Technology Management and a bachelor's degree in Telecommunication Engineering. His vision is to build an AI product using a graph neural network for students struggling with mental illness.