What is Augmented Analytics and How Has it Evolved?
Perhaps your business is considering an augmented analytics solution, or your enterprise already has some version of business intelligence or analytics and it wishes to upgrade or transition to a more beneficial solution. Maybe you just want to understand the analytics solution market better. This article will help you gather information about the topic of augmented analytics.
The world renowned technology research firm, Gartner, Defines Augmented Analytics in this way.
‘Augmented analytics is the use of enabling technologies such as machine learning and AI to assist with data preparation, insight generation and insight explanation to augment how people explore and analyze data in analytics and BI platforms. It also augments the expert and citizen data scientists by automating many aspects of data science, machine learning, and AI model development, management and deployment.’
‘You may wish to look for a solution that incorporates traditional BI with key performance indicators (KPIs) and flexible reporting and augmented analytics with AI, low-code and no-code technologies.’
If you are not already familiar with the term, ‘Citizen Data Scientist,’ you might want a definition of that term as well. Citizen Data Scientists are business users who enjoy data democratization and improved data literacy by adopting analytics tools that are easy to use and allow users with average technical skills to participate in sophisticated analytics and to use that analysis to make day-to-day decisions.
As Springboard notes, ‘Augmented Analytics is an example of human machine interaction in the data science field.’
The augmented analytics solution is typically supported by natural language processing (NLP) to support users in the query and results process. As with Google and other NLP interfaces, augmented analytics allows the user to ask a question using simple human language and receive results in the same way, so the business user does not have to write code, create complex SQL queries or wait for the in-house IT team or data scientist team to create reports.
The augmented analytics search engine allows users to factor in several variables, e.g., a list of sales team members, a time period or range, a category of products or items etc. So, you can ask, ‘Who sold the most bakery items in the Southwest region from September through November of 2022,’ and you will receive your results and can visualize your data in a way that makes sense to you and to your team.
The definition of Augmented Analytics can be broad, and all augmented analytics solutions are not equal in capabilities, features and functions.
For your business purposes, it is important that you have a clear picture of the augmented analytics definition, so that you, your management team, your IT team and your business users are all on the same page when it comes to your expectations for this product and service suite and for resulting benefits you can expect.
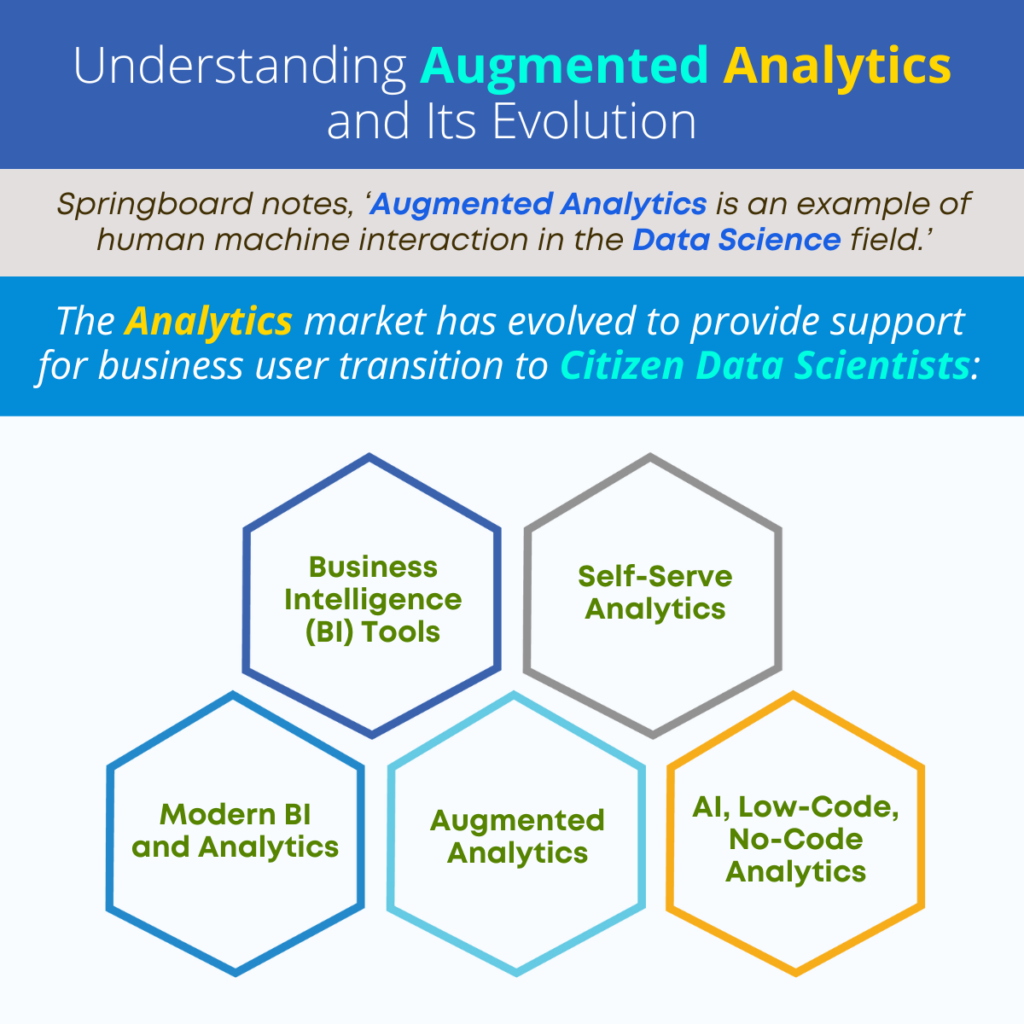
Just as with any other software or technology evolution, the analytics solution market has changed. As new technologies and techniques emerge, the wise analytics solution provider will leverage these new technologies to improve usability and create new features and functionality.
The Inception of Business Intelligence (BI) Tools: Historically, the business intelligence solution market was limited to systems and solutions to support data scientists and IT teams. These systems required users to create SQL queries and/or write code to gather and analyze data from multiple systems across the enterprise. In the early days, there was no one solution for data scientists and IT teams to use. Rather, they were writing queries to pull information and derive data from systems without a simple interface.
The Inception of Self-Serve Analytics: When the self-serve analytics market emerged, the traditional business intelligence (BI) tools supported business users with features like key performance indicators (KPIs) to establish and measure results using objective metrics, and with flexible report formats that enabled data visualization in a way that was meaningful to users. What is self-service analytics? We should probably explain before we move on.
Here is a brief definition of self-service analytics: Self-Serve Analytics is a solution that is designed to support business users who do not have data science or IT skills. When these tools were introduced to the market, they provided support for the first iteration of a Citizen Data Scientist approach.
Modern BI and Analytics: The evolution of business intelligence tools and analytics approaches saw the introduction of specific tools and features, designed for business users in a self-serve environment. The question, ‘what is self-service analytics,’ varied among enterprises, with some businesses limiting the use of these tools to power users and those team members who had a natural curiosity about analytics. Solution capabilities included Self-Serve Data Preparation, Smart Data Visualization and Predictive Analytics for forecasting, etc.
Augmented Analytics Explained: As self-serve augmented analytics began to evolve, new tools and techniques were added, and business users now enjoy the expanded capabilities of predictive analytics. Augmented Analytics vs Predictive Analytics is not really a question. The real question is how do you integrate predictive analytics into the world of the business user to allow them to test theories, prototype and use sophisticated algorithms and analytical techniques in an environment that can still be considered ‘self-serve,’ and ‘user friendly?’ With the right self-serve solution, users can leverage techniques like time series forecasting (Holt-Winters, ARIMA and ARIMAX), Regression techniques (simple and multiple linear regression), Classification (naïve-bayes, decision tree, K-nearest neighbor, binary logistic regression), Association including frequent pattern mining, Correlation including Spearman and Karl Pearson, Clustering including K Means and hierarchical, hypothesis testing (one-way Anova, Paired T-test, Chi-Squared Test) and Descriptive Statistics (Mean, Median, Mode, etc.). Additional tools like PMML Integration to provide simple language interpretation of models and enable predictions using single and multiple test records with user-friendly graphical user interface (GUI) or Web services API, Anomaly Monitoring and Alerts and Sentiment Analysis add to the suite of techniques to further enable self-serve analytics for the average business users.
Augmented Analytics Today and In the Future: Today, augmented analytics has changed in a number of ways. The foundation of the technology now provides better performance with low-code and no-code options to improve scalability and reduce the size of the solution for easier implementation, use and upgrade. Numerous publications, like BuiltIn and Berkeley write about the expansion of artificial intelligence (AI) in analytics. As AI advances and its use becomes more dependable it will find its way into more analytical solutions and its incorporation means more user-friendly tools for business users with more capabilities and functionality.
‘The definition of Augmented Analytics can be broad, and all augmented analytics solutions are not equal in capabilities, features and functions.’
Depending on the needs of your organization, you may wish to look for a solution that incorporates traditional BI with key performance indicators (KPIs) and flexible reporting and augmented analytics with AI, low-code and no-code technologies and advanced features, so that your data scientists and business users have a wide range of tools to satisfy their roles and responsibilities.
Contact Us to find out how augmented analytics Technology can support your enterprise, and ensure analytical clarity and results. Discover the next level of self-serve analytics with Augmented Analytics and explore the features and modules to see how your business can use analytics to achieve its goals.
 Advanced Analytics for Business Users, Assisted Predictive Modeling, Augmented Analytics Benefits, Augmented Analytics Company India, Citizen Data Scientists, Data Literacy, Natural Language Processing, Self-Serve Data Preparation, Smart Data Visualization Ahmedabad, Smarten Analytics, What is Augmented Analytics
Other posts