Is a dashboard a data story?
It is a question we get all the time. But I don’t think it is the right question. A better question is:
How can I apply concepts of data storytelling to dashboard design?
Dashboards are a form of data communication. Data storytelling is a collection of skills and concepts that help improve data communication. They are apples and oranges.
I want to share a few fundamental data storytelling skills that will make your dashboards more effective. Before that, it is worth understanding the purpose of a dashboard.
Like a snowflake, every dashboard is unique. Yet they share a set of common goals:
Provide visibility into data
Deliver a consistent, shared view of that data for a group of people
Present a overview of key metrics that are important to that group of people
Offer timely tracking of performance on those key metrics
Most fundamentally, a dashboard is an expression of priorities. The choices of metrics and data to show reflects what the organization wants to focus on.
To be effective, a dashboard needs to communicate well. It needs to be clear, concise, engaging, and organized. All that meaning — the metrics, trends, business logic — needs to be conveyed in a way that makes it easily readable for the audience.
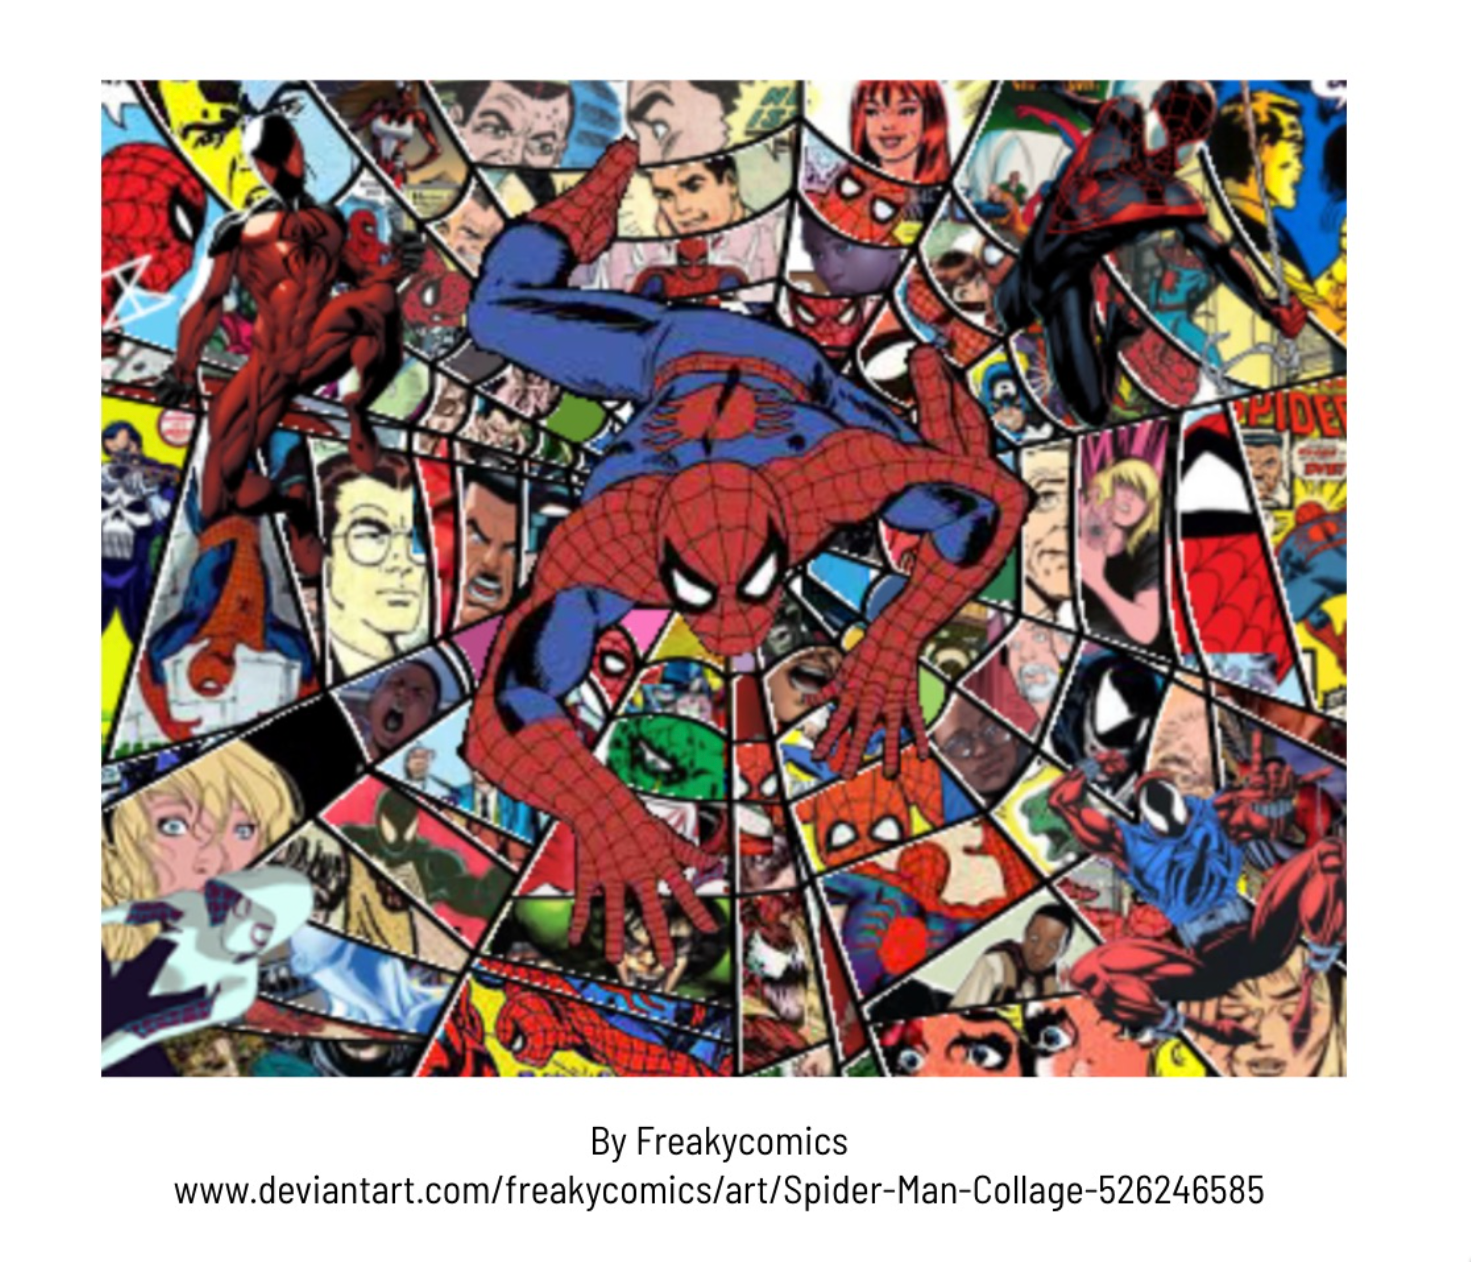
That’s where data storytelling comes in. Think of it like this: A bad dashboard is like a collage of data points (like the Spiderman image below), leaving the reader to search for meaning (also like Spiderman, ironically). A good dashboard, in contrast, should be be a guide for understanding — more like a comic strip.

How do you achieve a flow and logic that tells a story, even if that story is constantly changing?
Here are three common data storytelling skills that will make your dashboard better. If you are looking for more data storytelling design principles, check out our 12 Rules for Data Storytelling.
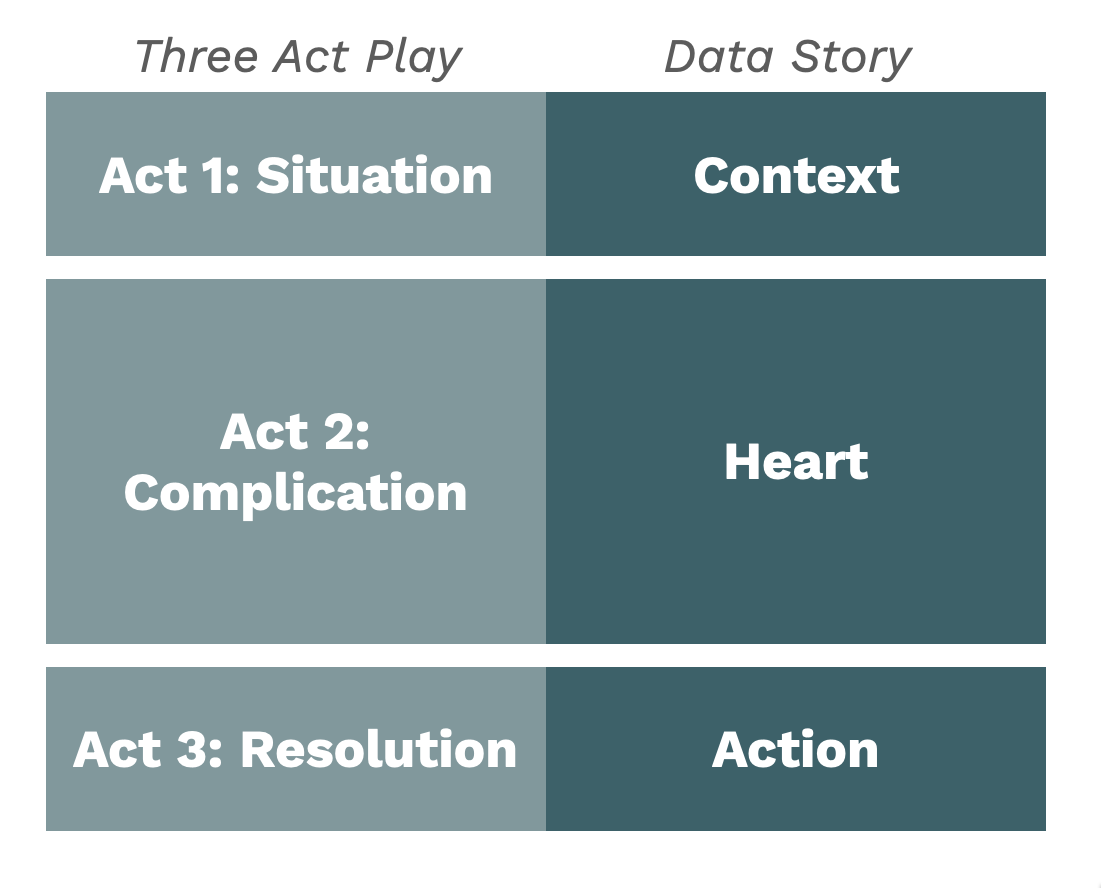
(1) Story structure
The three-act story structure is something that we inherently recognize (and expect) as an audience. By using these concepts in data stories, you can tap into the deeply-rooted expectations and needs of you audience. Below you can see how to map the three acts to the presentation of data. In a dashboard, it is critical to define the scope and purpose (why should someone care about your dashboard?) and help them understand what actions can be taken based on what they are seeing. Learn more from our Story Structure Lesson.
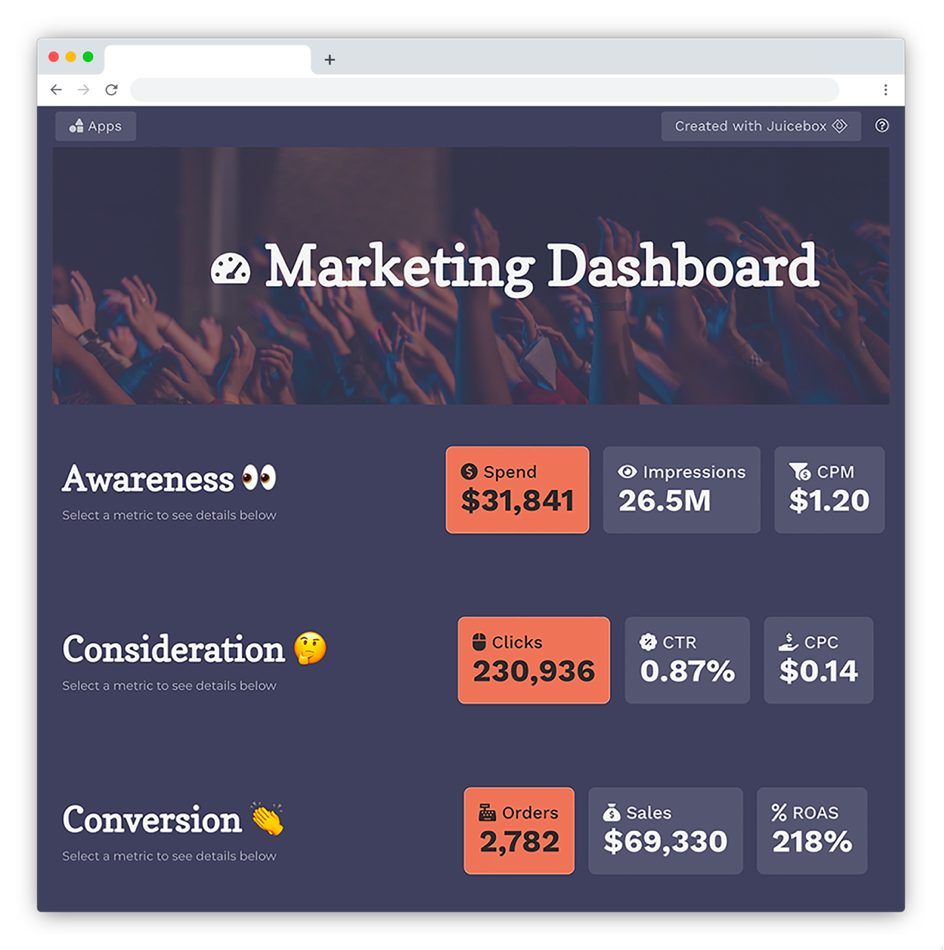
(2) Narrative
Dashboards shouldn’t only be able presenting data. You also need to act as a guide. There are four ways that you should think about providing narrative guidance:
Set the Context. Explain what the data story is about and why your audience should care.
Describe the Charts. What measures and dimensions are being shown? How should the chart be interpreted?
Guide the Flow. What should the reader look at next? What should they do to proceed in the story?
Highlight Insights and Actions. What's most valuable to take away from the data story? What should the reader do about it?
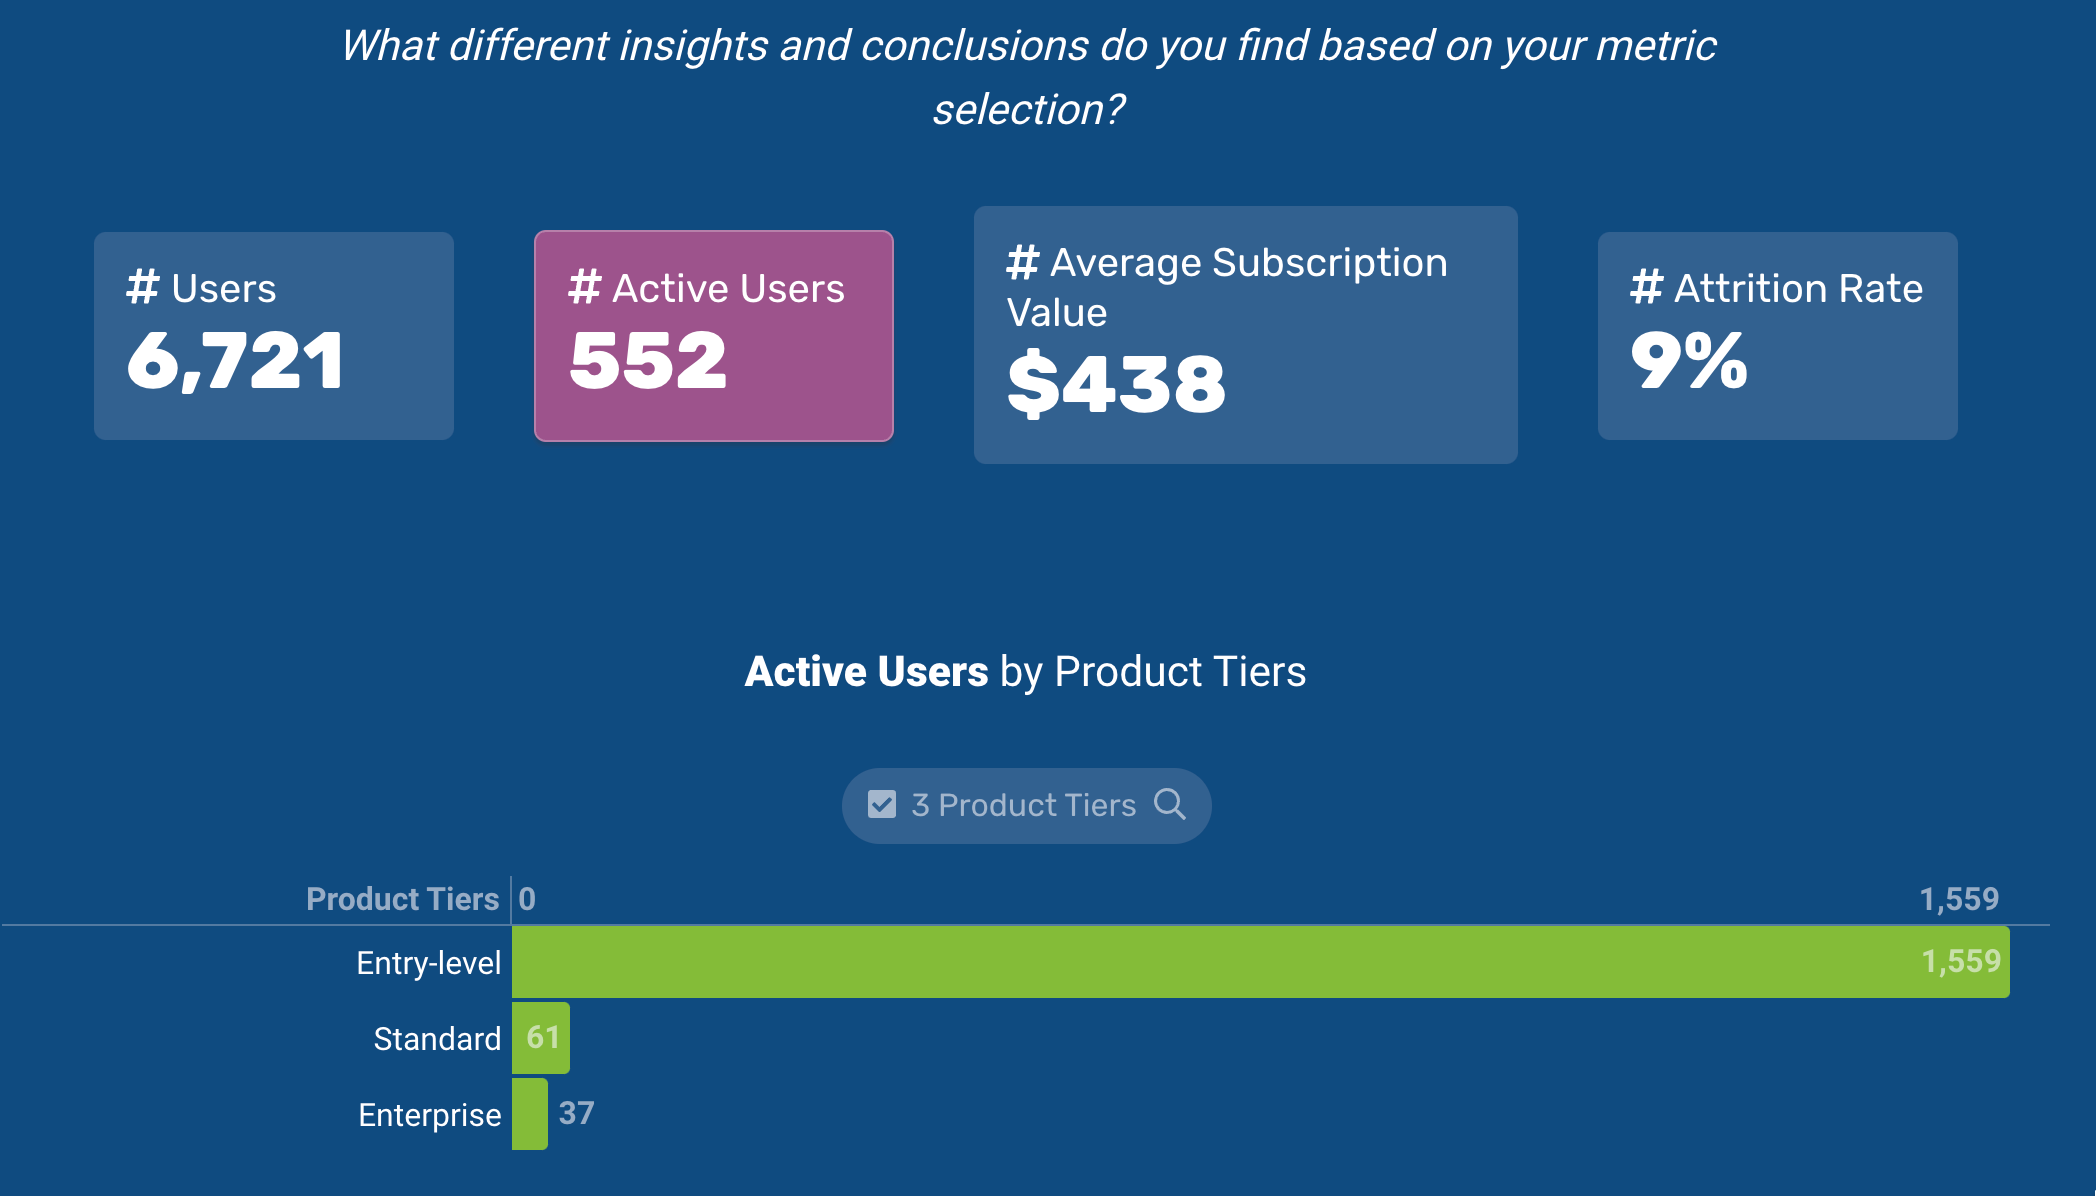
(3) Metrics as characters
Your choice of metrics is the most important decision you will make in designing the dashboard. These metrics need to reflect the priorities of your organization and be easy for people to understand. A few things to consider:
“You can't manage what you can't measure.” -- Peter Drucker. The reverse is also true. What you measure is what you will manage. The metrics you choose to include in your data story will influence priorities and goals.
Like characters in a story, too many metrics will overwhelm your audience. There is persistent pressure to include more ways to measure performance -- but this often reflects a lack of understanding of what matters most.
Metrics can either serve as the thing you want to see succeed (hero metrics) or something you want to disappear (villain metrics). Understanding this will help determine how the metric is presented.
Learn more in our Metrics: Your Story Characters lesson.