article thumbnail

Build Up Your Performance With KPI Scorecards – Examples & Templates

datapine

Tracking the success metrics based on your needs, and the time frame you select while comparing your values can be done with simple yet effective scorecards. What Is A KPI Scorecard? A KPI scorecard is a term used to describe a statistical record that measures progress or achievement towards a set performance indicator.

Scorecard 226
article thumbnail

10 Best Big Data Analytics Tools You Need To Know in 2023

FineReport

In this article, we will explore the importance of Big Data, why enterprises need Big Data tools, how to choose the right Big Data analytics tools and provide a list of the top 10 Big Data analytics tools available today. Descriptive Analytics is used to determine “what happened and why.” What is Big Data?

Insiders

Sign Up for our Newsletter

This site is protected by reCAPTCHA and the Google Privacy Policy and Terms of Service apply.

article thumbnail

A Beginner’s Guide To Inventory Metrics And Best Practices

datapine

In the matter, data analysis and dashboard designer software is a precious ally. We will finish by presenting a business dashboard that will show how those metrics work together when depicting an inventory data-story. Inventory Metrics Examples On Dynamic Dashboards. a) Inventory analytics dashboard for supply chain.

Metrics 286
article thumbnail

A Complete Guide To Driving Digital Transformation In Marketing

datapine

Several marketing dashboard tools allow you to generate automated online dashboards and reports to track your most relevant KPIs in one place. Your digital marketing KPIs can help marketers with additional essential multi-stage interaction and analytics tools. Refine Digital Channels.

article thumbnail

Visualize data quality scores and metrics generated by AWS Glue Data Quality

AWS Big Data

An operational scorecard is a mechanism used to evaluate and measure the quality of data processed and validated by AWS Glue Data Quality rulesets. We can query and submit the Athena data to QuickSight to create visuals for the dashboard. QuickSight offers a wide range of charts and visuals to help you create your dashboard.

article thumbnail

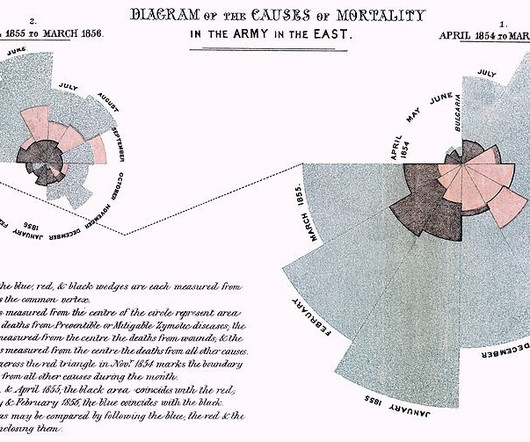
A Brief History of Data Visualization

Jet Global

Dashboards and data discovery tools, scorecard applications, analytics suites, and an assortment of other software tools enable businesses, researchers, and individuals to explore their data in new and increasingly imaginative ways.

article thumbnail

10 Ways That Corporate Dashboards Can Make Your Enterprise Life Easier

datapine

Whatever your sector or niche, if you want to remain adaptable and get one step ahead of the competition, working with the right data-driven tools and utilizing a corporate dashboard is essential. That’s where corporate dashboards come in. Your Chance: Want to create your own dynamic corporate dashboard? 1) CFO dashboard.