Stock Price Prediction and Forecasting using Stacked LSTM.
Introduction
Trying to predict how the securities exchange will work is one of the most difficult tasks. There are so many variables involved with the expectation – physical elements versus psychological factors, rational and irrational behaviour, and so on.
All of these factors combine to make share costs unpredictable and difficult to predict with any degree of certainty.Is it possible to use AI to our advantage in this space?AI approaches will potentially reveal examples and insights we hadn’t seen before, and these can be used to make unerringly exact expectations, using features like the most recent declarations of an organization, their quarterly income figures, and so on.
We will work with published information regarding a freely recorded organization’s stock costs in this report.We’ll use a combination of AI calculations to forecast this company’s future stock price with LSTM.
This article’s main purpose is to demonstrate how these calculations are carried out. Also, In this Article We will talking about the stock price prediction lstm how to predict the data by LSTM. I’ll provide a quick overview of the process and make key connections to revisit the concepts as needed. If you’re new to the world of time management, I suggest starting with the articles below.
This article was published as a part of the Data Science Blogathon
Why do you Need Time Series Models?
\Time series models are mostly used for trend analysis and future prediction.
Recognizing trends: Data points in a time series are gathered at particular intervals of time. We can find recurring patterns and trends in this data by studying it. This can be helpful for things like figuring out what influences sales numbers or how long hospital patient wait times vary throughout the day.
Future forecasting: Using historical data, time series models can be used to project values in the future. This is useful in a variety of sectors. For example, time series models can be used by businesses to predict product demand, which can aid in inventory control. In a similar vein, time series models are used by meteorologists to forecast weather trends. A thorough guide to time series analysis and forecasting:
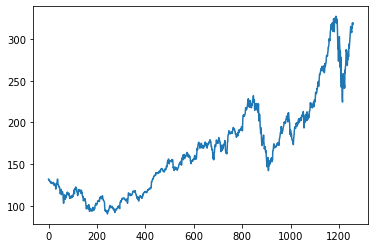
Loading the Data
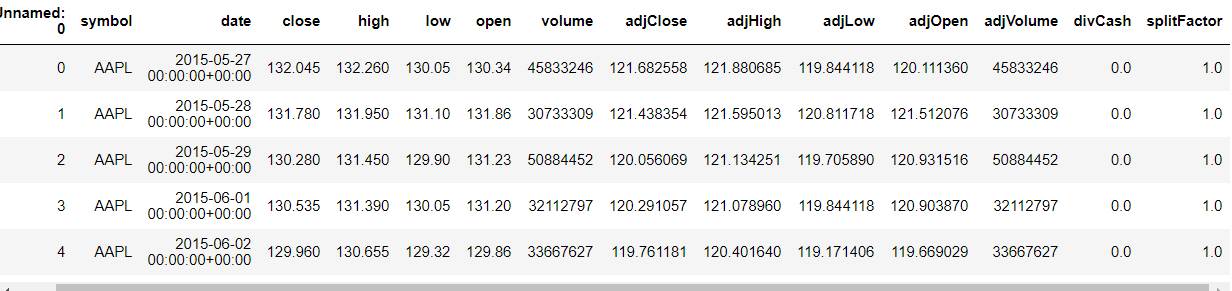
df1=df.reset_index()['close']
Now get into the Solution:
LSTM is very sensitive to the scale of the data, Here the scale of the Close value is in a kind of scale, we should always try to transform the value.
Here we will use min-max scalar to transform the values from 0 to 1.We should reshape so that we can use fit transform.
Code:
from sklearn.preprocessing import MinMaxScaler
scaler=MinMaxScaler(feature_range=(0,1))
df1=scaler.fit_transform(np.array(df1).reshape(-1,1))
Train and Test Split
Whenever training Timeseries data we should divide the data differently we should train the data with the respective date.
Always remember that in time-series data the one data is dependent on other data. The training size should be 65% of the total length of the data frame, the test size should be the difference between the length of the dataset and the training size.
Code:
training_size=int(len(df1)*0.65)
test_size=len(df1)-training_size
train_data,test_data=df1[0:training_size,:],df1[training_size:len(df1),:1]
Train data and Test data is ready.
Data Preprocessing
Now consider the time steps, if I want to predict the price of the stock in a day that how previous data should be considered.
Now the timestep value will be 100. Let’s split the data X, Y. In the 0th iteration the first 100 elements goes as your first record and the 101 elements will be put up in the X. The 100 elements will be put up in the Y.
Code:
import numpy
def create_dataset(dataset, time_step=1):
dataX, dataY = [], []
for i in range(len(dataset)-time_step-1):
a = dataset[i:(i+time_step), 0]
dataX.append(a)
dataY.append(dataset[i + time_step, 0])
return numpy.array(dataX), numpy.array(dataY)
time_step = 100
X_train, y_train = create_dataset(train_data, time_step)
X_test, ytest = create_dataset(test_data, time_step)
LSTM
LSTMs are widely used for sequence prediction problems and have proven to be extremely effective. The reason they work so well is that LSTM can store past important information and forget the information that is not.
LSTM has three gates:
- The input gate: The input gate adds information to the cell state,
- The forget gate: It removes the information that is no longer required by the model,
- The output gate: Output Gate at LSTM selects the information to be shown as output.
While Implementing any LSTM, we should always reshape our X train in 3-D, add 1 the reason behind is the time step and the 1 is given to the LSTM.
Code:
X_train =X_train.reshape(X_train.shape[0],X_train.shape[1] , 1)
X_test = X_test.reshape(X_test.shape[0],X_test.shape[1] , 1)
Then import required modules for the stacked LSTM.
Code:
from tensorflow.keras.models import Sequential
from tensorflow.keras.layers import Dense
from tensorflow.keras.layers import LSTM
We will be using a sequential model and adding the layers of the LSTM as said, in the above sentence. The first layer should be the time step in 1.
Code:
model=Sequential()
model.add(LSTM(50,return_sequences=True,input_shape=(100,1)))
model.add(LSTM(50,return_sequences=True))
model.add(LSTM(50))
model.add(Dense(1))
model.compile(loss='mean_squared_error',optimizer='adam')
Let’s see the summary.
Now the final part is to fit the X_train and the y_train.
Prediction
Predict both the X_train and the X_test, now let’s scaler inverse transform because I want to see the root mean square performance.
Code:
train_predict=model.predict(X_train)
test_predict=model.predict(X_test)
train_predict=scaler.inverse_transform(train_predict)
test_predict=scaler.inverse_transform(test_predict)
Code:
import math
from sklearn.metrics import mean_squared_error
math.sqrt(mean_squared_error(y_train,train_predict))
Here the time step is 100, Whatever the values in train predict and test predict. I got I am just plotting it don’t forget we have to inverse the scaler transform.
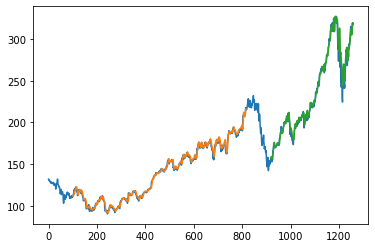
- Green indicates the Predicted Data
- Blue indicates the Complete Data
- Orange indicates the Train Data
If I consider the last date in the test data as of 22-05-2020, I want to predict the output of 23-05-2020. We need the previous 100 data for that I am taking the data and reshaping it.
Code:
x_input=test_data[341:].reshape(1,-1)
x_input.shape
So, you can predict the prices of preferred stocks using this strategy.
LSTM trading Strategy
One kind of recurrent neural network (RNN) that can be used to create trading strategies is the Long Short-Term Memory (LSTM) network. This is an explanation of how LSTMs are used in this situation:
Idea:
Because LSTMs are good with sequential data, they can be used to analyze historical financial data, including trade volume, opening and closing prices, and technical indicators.
The model attempts to identify trends and forecast future price movements by examining these sequences.
Techniques:
Long-Only Strategy: This tactic forecasts the direction of prices. The model recommends purchasing the item and selling it for a profit at a later time if a price increase is anticipated. On the other hand, when a price decline is anticipated, nothing happens.
Using the long-short method, one can profit from both increasing and decreasing prices.
Inference:
Conclusion:
In this article, we have seen how to predict a stock price; this is a simple algorithm; we have talked about Stock Price Prediction lstm. You can make use of auto-ml so that the adding of new data will be easy. Refer a lot of Deep Learning Algorithms, Machine Learning … etc.
Thanks for spending your timing in reading the article.
The media shown in this article are not owned by Analytics Vidhya and is used at the Author’s discretion.


I think you have a leak in the data scaling you should scale the training and testing data seperatly