article thumbnail

Top 15 Warehouse KPIs & Metrics For Efficient Management 

datapine

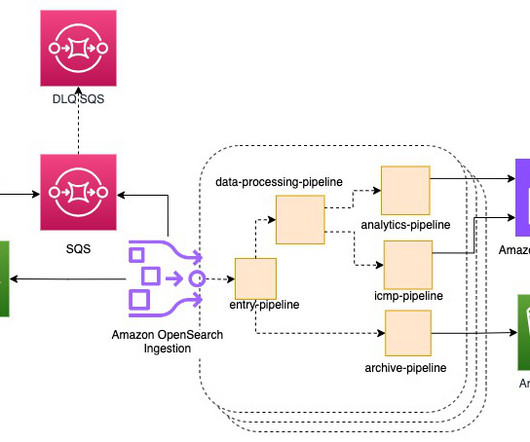
3) Top 15 Warehouse KPIs Examples 4) Warehouse KPI Dashboard Template The use of big data and analytics technologies has become increasingly popular across industries. Making the use of warehousing metrics a huge competitive advantage. Your Chance: Want to visualize & track warehouse KPIs with ease?

Metrics 217
article thumbnail

Enhance monitoring and debugging for AWS Glue jobs using new job observability metrics, Part 3: Visualization and trend analysis using Amazon QuickSight

AWS Big Data

In Part 2 of this series, we discussed how to enable AWS Glue job observability metrics and integrate them with Grafana for real-time monitoring. QuickSight makes it straightforward for business users to visualize data in interactive dashboards and reports. Grafana provides powerful customizable dashboards to view pipeline health.

Metrics 104
Insiders

Sign Up for our Newsletter

This site is protected by reCAPTCHA and the Google Privacy Policy and Terms of Service apply.

article thumbnail

Remove Your Rose Tinted Glasses: Data Visualizations Designed to Mislead

datapine

1) Misleading Data Visualization Examples. 2) How to Avoid Misleading Visuals. 3) The Impact Of Bad Data Visualizations. But while that may be the case, people are duped by data visualizations every day. Bad data visualizations come in many forms, with some more obvious than others. Table of Contents.

article thumbnail

A Beginner’s Guide To Inventory Metrics And Best Practices

datapine

At the same time, inventory metrics are needed to help managers and professionals in reaching established goals, optimizing processes, and increasing business value. Collecting big amounts of data is not the only thing to do; knowing how to process, analyze, and visualize the insights you gain from it is key.

Metrics 286
article thumbnail

Take Advantage Of Operational Metrics & KPI Examples – A Comprehensive Guide

datapine

By establishing clear operational metrics and evaluate performance, companies have the advantage of using what is crucial to stay competitive in the market, and that’s data. Your Chance: Want to visualize & track operational metrics with ease? What Are Metrics And Why Are They Important?

KPI 269
article thumbnail

DirectX Visualization Optimizes Analytics Algorithmic Traders

Smart Data Collective

Learn how DirectX visualization can improve your study and assessment of different trading instruments for maximum productivity and profitability. Analytics technology has become an invaluable aspect of modern financial trading. Unfortunately mastering the nuances of financial analytics tools isn’t easy.

article thumbnail

Two Downs Make Two Ups: The Only Success Metrics That Matter For Your Data & Analytics Team

DataKitchen

How to measure your data analytics team? So it’s Monday, and you lead a data analytics team of perhaps 30 people. But wait, she asks you for your team metrics. Like most leaders of data analytic teams, you have been doing very little to quantify your team’s success. Where is your metrics report?

Metrics 130