Python in Excel: Opening the Door to Advanced Data Analytics
Introduction
Microsoft announced the integration of Python programming language into Excel, marking a significant advancement in the field. The foundational data management, analysis, and visualization tool, Microsoft Excel, has taken a significant step forward in its analytical capabilities by incorporating Python functionality. This integration marks a significant milestone in data analysis, machine learning, predictive analytics, and data cleaning, seamlessly accessible within the familiar Excel environment. This innovation combines the advanced features of the Python programming language and the recognizable Excel interface, effectively closing the gap between the two. Microsoft has officially launched the public preview of Python within Excel. This capability seamlessly merges the powerful capabilities of Python scripting with the familiar and versatile nature of Excel formulas, all within the confines of a single workbook.
Excel users will now be able to craft formulas and charts using data from Python. They can also integrate charting libraries like Matplotlib and Seaborn to design visualizations such as heatmap displays, violin plots, and swarm plots. Exclusive early access to this innovation will be provided to Microsoft 365 Insiders through the beta channel release of Excel for Windows.
This article was published as a part of the Data Science Blogathon.
Table of contents
Simplify with = PY ()
To start utilizing Python in Excel, pick a cell, access the Formulas tab in the ribbon, and click “Insert Python.” This prompts Excel to recognize our intention to create a Python formula within the designated cell. Or use the function =PY. We can use the formula bar for code-like editing behavior.

Utilize the formula bar for editing your code, much like programming. Press Enter to create new lines. Expand the formula bar by clicking the downward arrow icon to see multiple lines of code at once.
Within Excel, we can utilize the powerful functionalities of Python libraries to craft visualizations, create machine-learning models, and perform advanced analytics. The integration of Python directly into Excel is facilitated by the new PY function, which allows us to input Python code directly into Excel cells. There is no need to install any additional tools to use Python in Excel. After clicking the “Insert Python” button in the Excel ribbon’s Formulas section, we can begin writing our Python code.
Built-in XL() Python Function
The built-in xl() Python function enables the transmission of data from workbooks, and it can return Python code output as the result of =PY(). By default, a Python cell sets the output format to Excel value, transforming any Python object’s value generated by the cell’s code into a format resembling Excel’s output.
Excel offers built-in connectors and utilizes Power Query, Microsoft’s data manipulation tool, to facilitate the import of external data.
For importing data from external sources, utilize Excel’s Get & Transform feature. This feature uses Power Query to facilitate the import process. Remember that any data we work with using Python in Excel should either originate from our worksheet or through Power Query.
Microsoft has collaborated with Anaconda to offer professional libraries and assistance, ensuring data analysts and scientists can benefit from high-quality resources.
Order of Computation
In standard Python code, execute calculations sequentially from the top to the bottom. Similarly, the computations follow the same top-to-bottom pattern when using Python within an Excel cell. However, in a Python in Excel worksheet, calculations in Python cells occur in a row-major order.
For example, suppose we have a Python object or formula in a specific cell, such as cell B15. In that case, we cannot directly refer to or use another Python object or formula in a different cell, like cell B16. The two Python objects/formulas in these cells cannot interact with each other within the Excel environment. Each Python
object/formula operates independently in its designated cell without direct access or communication with Python objects/formulas in other cells.
Python instructions are put in a specific order. This means that each instruction relies on the one just before it for the calculation to work correctly.
Data Manipulation in Excel
Python is a versatile tool for data cleaning, manipulation, experimenting with machine learning models, and generating plots – all within the secure boundaries of the Excel environment. When we can directly input Python code into a cell, process the calculations in the Microsoft Cloud, and the generated results, including plots and visualizations, are seamlessly incorporated into the worksheet.


Secure Environment
Microsoft guarantees the secure execution of Python in Excel within the Microsoft Cloud infrastructure, integrating enterprise-grade security into the Microsoft 365 experience. This guarantee ensures that the code executes within the Microsoft Cloud environment, not locally. It isolates it within a secure container using Azure Container Instances, enhancing security measures and preventing unauthorized access.
Integrating Python Libraries for Excel Advancements

It facilitates the integration of a broad spectrum of Python packages. Within Excel, we gain access to libraries like pandas for data manipulation, statsmodels for advanced statistical modeling, Matplotlib, and Seaborn for creating graphical representations of data.

Collaborating with Team Members
Users can confidently share Python in Excel workbooks with team members. Colleagues can effortlessly engage with and update Python-based analytics within Excel, all without the need to concern themselves with installing extra software, Python runtimes, or handling libraries and dependencies.
How to use Python in Excel?
If you have the latest insider version of Excel, follow these steps to access Python in excel. Select Insert Python, then select custom python formula and box changes into Python mode.


Otherwise, we can directly type =py in any cell, and Python mode is activated.
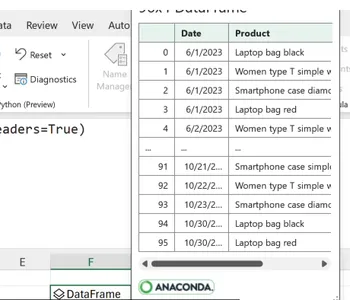
The first step is to select the dataset of Excel and send it to Python for creating a dataframe. We can do this just by referencing the cells of Excel. When we hit ctrl+enter, a dataframe is created.

We can switch our view to Excel or python using the Python output dropdown.

If we need to view the dataset, click on the datacard, and we can see the starting and ending of the dataframe.
Let’s see an example for groupby for the sales column of this dataset.

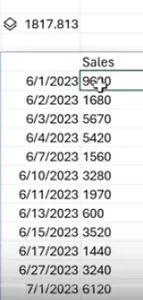
In this, everything is grouped according to the date. Even if we change any values in the original dataset, the results will immediately reflect the changes. Whatever appears in the cell is a result of l.
Limitations
- As Python computations are carried out on Microsoft’s cloud platform, any personalized adjustments made to the user’s local Python setup won’t be automatically reflected in Python integrated with Excel. Like many collaborative tools, Python in Excel requires an internet connection.
- Establishing a connection to the Power Pivot Data Model is not feasible.
- Power Query does not support Excel Tables present in the ongoing file. A direct connection to the Table is necessary.
- Animated charts created using Python are currently not compatible or functional.
- Currently only available in Excel Desktop for Windows for Microsoft 365 Insiders Beta Channel users with Version 2309 Build 16.0.16818.20000 or later.
- Once the initial testing phase accessible to the public is completed, there might be constraints associated with employing Python within Excel. These constraints could include restricted assistance and possible conflicts with forthcoming versions of Excel.
This combination effectively leverages both the power of Python and the flexibility of Excel. In the history of attempts to integrate Python and Excel, including using intermediary libraries and premium add-ons like PyXLL to enhance Python’s capabilities within Excel, the present integration is a significant advancement. Python in Excel’s ecosystem heralds a new era of remarkable synergy. This integration offers the potential to enable users in data analysis, automation, and visualization – formerly exclusive to Python or Excel.
Currently, this feature is in the Public Preview phase, Following the preview period, Microsoft has indicated that certain functionalities will require a specific license and won’t be accessible without it. Further information about this will be provided as the general availability (GA) date approaches.
Although the exact GA dates have yet to be disclosed, Microsoft has a vision of enhancing user experience by integrating extra features, such as syntax highlighting, autocomplete, and improved error feedback.
Conclusion
Integrating Python into Excel represents a transformative synergy that empowers users to harness the full potential of both tools. This dynamic combination simplifies complex data manipulation and analysis and allows automation, customization, and data-driven decision-making. Python’s versatility and Excel’s user-friendly interface create a powerful tandem that can benefit professionals across various industries. Whether you are a data analyst, a financial expert, or a business strategist, embracing Python in Excel can enhance your productivity and bring your data projects to a new level. As spreadsheets and programming continue to converge, embracing this collaboration will undoubtedly become essential for professionals in the data-driven era.
Frequently Asked Questions
A. Power Query is a data extraction and transformation tool made by Microsoft for data extraction and transformation. Its purpose is to aid users in connecting to, cleansing, and readying data from diverse sources. This capability extends to Microsoft products, enabling effortless data retrieval and manipulation within a user-friendly environment that doesn’t require coding expertise.
A. A violin plot is a graphical representation to visualize the distribution of numeric data within one or multiple groups. It employs density curves to show the distributions. The width of each curve corresponds to the estimated frequency of data points in specific regions. These density curves have an additional chart type overlaid, like a box plot, to offer supplementary insights. A swarm plot is a variation of a scatter plot to depict categorical values. It shares similarities with a strip plot, but it prevents the overlap of data points.
A. PyXLL is an Excel add-in that enables users to integrate Python code and functionality directly into Microsoft Excel. PyXLL enables tasks such as data analysis, manipulation, and complex calculations using Python’s extensive libraries and capabilities.
The media shown in this article is not owned by Analytics Vidhya and is used at the Author’s discretion.


