Read more articles on Text Classification, here.
Thank you for your time and for reading my article. Please feel free to contact me if you have any questions or would like to share your comments.
This article was published as a part of the Data Science Blogathon
A news article discusses current or recent news of either general interest (i.e. daily newspapers) or on a specific topic (i.e. political or trade news magazines, club newsletters, or technology news websites). A news article can include accounts of eyewitnesses to the happening event. We must have seen the news divided into categories when we go to a news website. Some of the popular categories that you’ll see on almost any news website are tech, entertainment, sports, etc. If you want to know how to classify news categories using machine learning, this article is for you.
Every news website classifies the news article before publishing it so that every time visitors visit their website can easily click on the type of news that interests them. For example, I like to read the latest technology updates, so every time I visit a news website, I click on the technology section. But you may or may not like to read about technology, you may be interested in politics, business, entertainment, or maybe sports. Currently, the news articles are classified by hand by the content managers of news websites. But to save time, they can also implement a machine learning model on their websites that read the news headline or the content of the news and classifies the category of the news.
Text classification datasets are used to categorize natural language texts according to content. For example, think classifying news articles by topic, or classifying book reviews based on a positive or negative response. Text classification is also helpful for language detection, organizing customer feedback, and fraud detection.
While this process is time-consuming when done manually, it can be automated with machine learning models.
Category classification, for news, is a multi-label text classification problem. The goal is to assign one or more categories to a news article. A standard technique in multi-label text classification is to use a set of binary classifiers.
For the task of news classification with machine learning, I have collected a dataset from Kaggle, which contains news articles including their headlines and categories.
Data Fields
Data preprocessing is the process of transforming raw data into an understandable format. It is also an important step in data mining as we cannot work with raw data. The quality of the data should be checked before applying machine learning or data mining algorithms.
let’s import the necessary Python libraries and the dataset that we need for this task.
import pandas as pd
import numpy as np
import matplotlib.pyplot as plt
import seaborn as sns
import re
import nltk
from nltk.corpus import stopwords
nltk.download('stopwords')
from nltk.stem import PorterStemmer
from nltk.stem import WordNetLemmatizer
nltk.download('wordnet')
from nltk.tokenize import word_tokenize
from nltk.tokenize import sent_tokenize
nltk.download('punkt')
from wordcloud import WordCloud
from sklearn.feature_extraction.text import CountVectorizer
from sklearn.feature_extraction.text import TfidfVectorizer
from sklearn.model_selection import train_test_split
from sklearn.metrics import accuracy_score
from sklearn.metrics import confusion_matrix
from sklearn.metrics import classification_report
from sklearn.metrics import make_scorer, roc_curve, roc_auc_score
from sklearn.metrics import precision_recall_fscore_support as score
from sklearn.metrics.pairwise import cosine_similarity
from sklearn.multiclass import OneVsRestClassifier
from sklearn.linear_model import LogisticRegression
from sklearn.svm import SVC, LinearSVC
from sklearn.tree import DecisionTreeClassifier
from sklearn.ensemble import RandomForestClassifier
from sklearn.neighbors import KNeighborsClassifier
from sklearn.naive_bayes import GaussianNB,MultinomialNB,BernoulliNB
Import the dataset which we will have to use.
Check the shape (row and column) of the dataset.
dataset.shape

dataset.info()
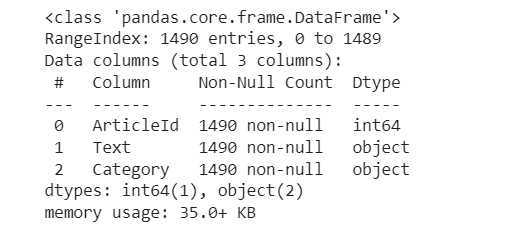
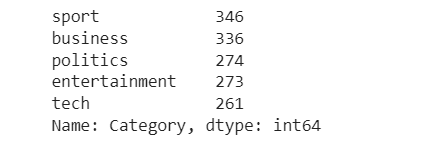
There are five news categories i.e. Sports, Business, Politics, Entertainment, Tech.
dataset['Category'].value_counts()
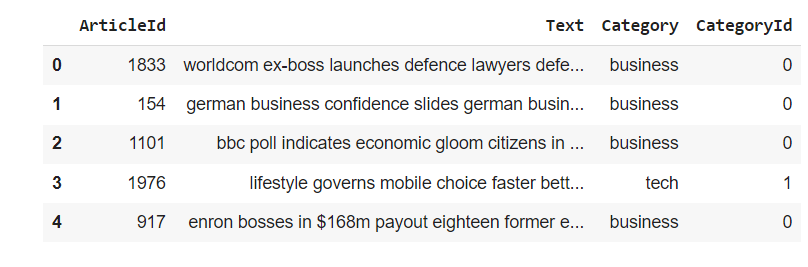
Convert the given news categories into categorical values.
# Associate Category names with numerical index and save it in new column CategoryId
target_category = dataset['Category'].unique()
print(target_category)

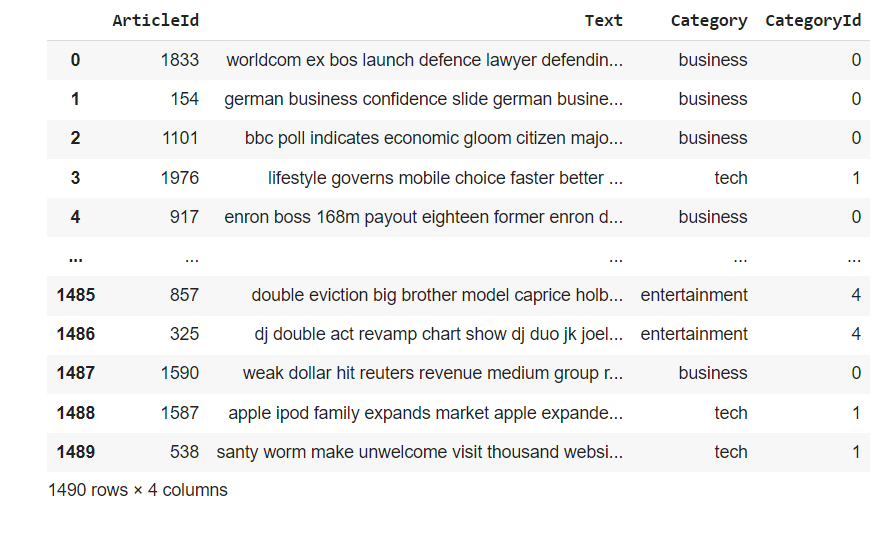
dataset['CategoryId'] = dataset['Category'].factorize()[0]
dataset.head()
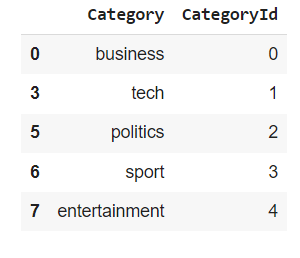
Here you can show that news category’s name with respect to the following unique category ID.
# Create a new pandas dataframe "category", which only has unique Categories, also sorting this list in order of CategoryId values
category = dataset[['Category', 'CategoryId']].drop_duplicates().sort_values('CategoryId')
category
In data mining, Exploratory Data Analysis (EDA) is an approach to analyzing datasets to summarize their main characteristics, often with visual methods. EDA is used for seeing what the data can tell us before the modeling task. It is not easy to look at a column of numbers or a whole spreadsheet and determine important characteristics of the data. It may be tedious, boring, and/or overwhelming to derive insights by looking at plain numbers. Exploratory data analysis techniques have been devised as an aid in this situation.
The below graph shows the news article count for category from our dataset.
dataset.groupby('Category').CategoryId.value_counts().plot(kind = "bar", color = ["pink", "orange", "red", "yellow", "blue"])
plt.xlabel("Category of data")
plt.title("Visulaize numbers of Category of data")
plt.show()
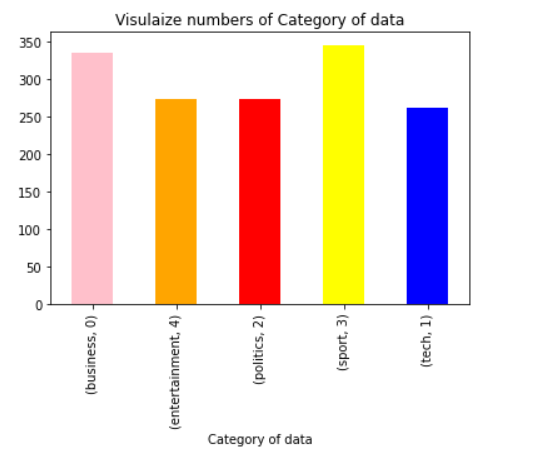
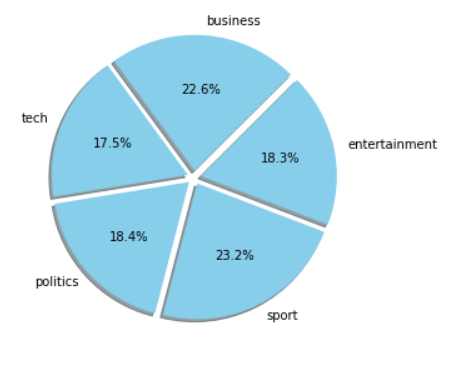
fig = plt.figure(figsize = (5,5))
colors = ["skyblue"]
business = dataset[dataset['CategoryId'] == 0 ]
tech = dataset[dataset['CategoryId'] == 1 ]
politics = dataset[dataset['CategoryId'] == 2]
sport = dataset[dataset['CategoryId'] == 3]
entertainment = dataset[dataset['CategoryId'] == 4]
count = [business['CategoryId'].count(), tech['CategoryId'].count(), politics['CategoryId'].count(), sport['CategoryId'].count(), entertainment['CategoryId'].count()]
pie = plt.pie(count, labels = ['business', 'tech', 'politics', 'sport', 'entertainment'],
              autopct = "%1.1f%%",
              shadow = True,
              colors = colors,
              startangle = 45,
              explode = (0.05, 0.05, 0.05, 0.05,0.05))
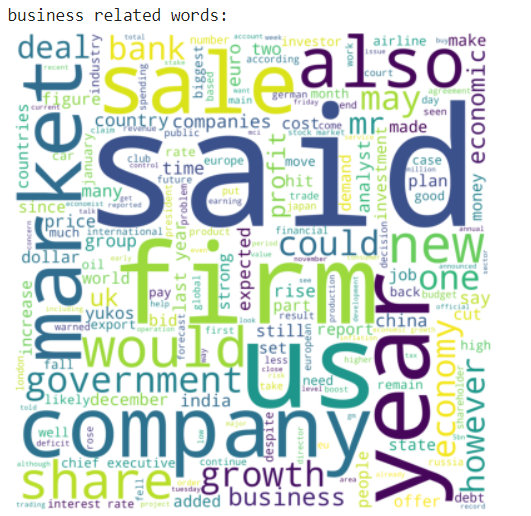
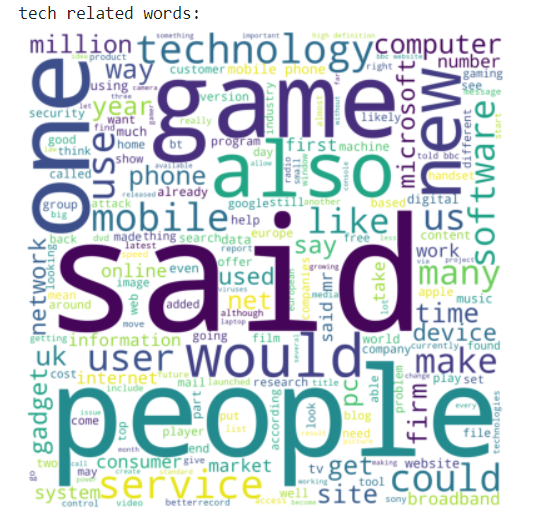
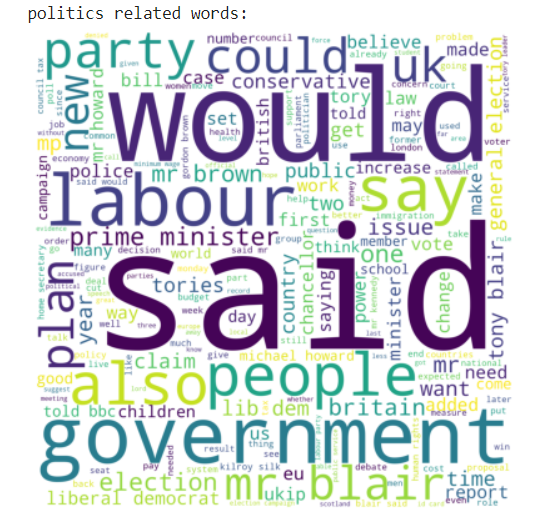
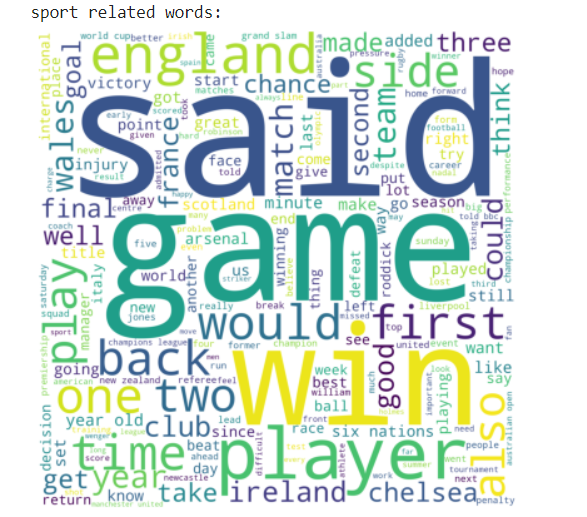
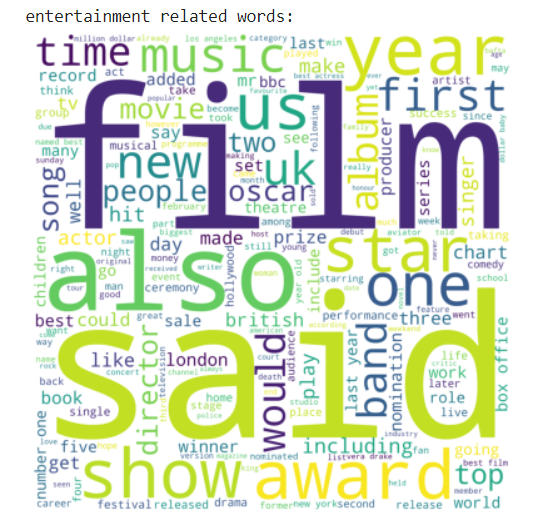
Here we use the word cloud module to show the category-related words.
Word Cloud is a data visualization technique used for representing text data in which the size of each word indicates its frequency or importance. Significant textual data points can be highlighted using a word cloud. Word clouds are widely used for analyzing data from social network websites.
from wordcloud import WordCloud

stop = set(stopwords.words('english'))

business = dataset[dataset['CategoryId'] == 0]

business = business['Text']

tech = dataset[dataset['CategoryId'] == 1]

tech = tech['Text']

politics = dataset[dataset['CategoryId'] == 2]

politics = politics['Text']

sport = dataset[dataset['CategoryId'] == 3]

sport = sport['Text']

entertainment = dataset[dataset['CategoryId'] == 4]

entertainment = entertainment['Text']

def wordcloud_draw(dataset, color = 'white'):

words = ' '.join(dataset)

cleaned_word = ' '.join([word for word in words.split()

if (word != 'news' and word != 'text')])

wordcloud = WordCloud(stopwords = stop,

background_color = color,

width = 2500, height = 2500).generate(cleaned_word)

plt.figure(1, figsize = (10,7))

plt.imshow(wordcloud)

plt.axis("off")

plt.show()

print("business related words:")

wordcloud_draw(business, 'white')

print("tech related words:")

wordcloud_draw(tech, 'white')

print("politics related words:")

wordcloud_draw(politics, 'white')

print("sport related words:")

wordcloud_draw(sport, 'white')

print("entertainment related words:")

wordcloud_draw(entertainment, 'white')
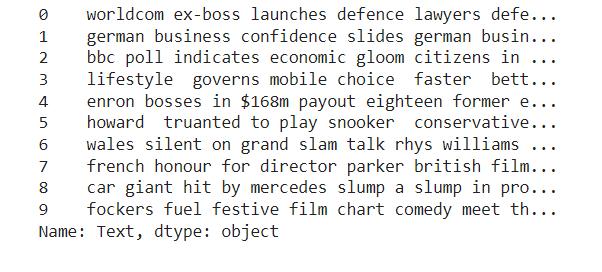
text = dataset["Text"]
text.head(10)
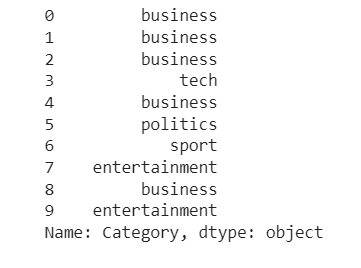
category = dataset['Category']
category.head(10)
First, we remove all tags which are present in our given dataset.
def remove_tags(text):
  remove = re.compile(r'')
  return re.sub(remove, '', text)
dataset['Text'] = dataset['Text'].apply(remove_tags)
Here we remove all the special characters.
def special_char(text):
  reviews = ''
  for x in text:
    if x.isalnum():
      reviews = reviews + x
    else:
      reviews = reviews + ' '
  return reviews
dataset['Text'] = dataset['Text'].apply(special_char)
We convert all articles or text to lower case.
It is one of the simplest and most effective forms of text preprocessing. It is applicable to most text mining and NLP problems and can help in cases where your dataset is not very large and significantly helps with the consistency of expected output.
def convert_lower(text):
   return text.lower()
dataset['Text'] = dataset['Text'].apply(convert_lower)
dataset['Text'][1]
A stop word is a commonly used word (such as “the”, “a”, “an”, “in”) that a search engine has been programmed to ignore, both when indexing entries for searching and when retrieving them as the result of a search query.
We would not want these words to take up space in our database, or take up the valuable processing time. For this, we can remove them easily, by storing a list of words that you consider to stop words. NLTK(Natural Language Toolkit) in python has a list of stopwords stored in 16 different languages.
def remove_stopwords(text):
  stop_words = set(stopwords.words('english'))
  words = word_tokenize(text)
  return [x for x in words if x not in stop_words]
dataset['Text'] = dataset['Text'].apply(remove_stopwords)
dataset['Text'][1]
Lemmatization is the process of grouping together the different inflected forms of a word so they can be analyzed as a single item. Lemmatization is similar to stemming but it brings context to the words. So it links words with similar meanings to one word. lemmatization is preferred over Stemming because lemmatization does morphological analysis of the words.
def lemmatize_word(text):
  wordnet = WordNetLemmatizer()
  return " ".join([wordnet.lemmatize(word) for word in text])
dataset['Text'] = dataset['Text'].apply(lemmatize_word)
dataset['Text'][1]
dataset
x = dataset['Text']
y = dataset['CategoryId']
In this step, we construct a vector, which would tell us whether a word in each sentence is a frequent word or not. If a word in a sentence is a frequent word, we set it as 1, else we set it as 0.
Whenever we apply any algorithm in NLP, it works on numbers. We cannot directly feed our text into that algorithm. Hence, the Bag of Words model is used to preprocess the text by converting it into a bag of words, which keeps a count of the total occurrences of the most frequently used words.
from sklearn.feature_extraction.text import CountVectorizer
x = np.array(dataset.iloc[:,0].values)
y = np.array(dataset.CategoryId.values)
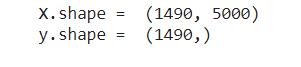
cv = CountVectorizer(max_features = 5000)
x = cv.fit_transform(dataset.Text).toarray()
print("X.shape = ",x.shape)
print("y.shape = ",y.shape)
We need to split a dataset into train and test sets to evaluate how well our machine learning model performs. The train set is used to fit the model, the statistics of the train set are known. The second set is called the test data set, this set is solely used for predictions.
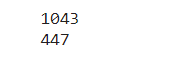
from sklearn.model_selection import train_test_split
x_train, x_test, y_train, y_test = train_test_split(x, y, test_size = 0.3, random_state = 0, shuffle = True)
print(len(x_train))
print(len(x_test))
#create list of model and accuracy dicts
perform_list = [ ]
def run_model(model_name, est_c, est_pnlty):
mdl=''
if model_name == 'Logistic Regression':
mdl = LogisticRegression()
elif model_name == 'Random Forest':
mdl = RandomForestClassifier(n_estimators=100 ,criterion='entropy' , random_state=0)
elif model_name == 'Multinomial Naive Bayes':
mdl = MultinomialNB(alpha=1.0,fit_prior=True)
elif model_name == 'Support Vector Classifer':
mdl = SVC()
elif model_name == 'Decision Tree Classifier':
mdl = DecisionTreeClassifier()
elif model_name == 'K Nearest Neighbour':
mdl = KNeighborsClassifier(n_neighbors=10 , metric= 'minkowski' , p = 4)
elif model_name == 'Gaussian Naive Bayes':
mdl = GaussianNB()
oneVsRest = OneVsRestClassifier(mdl)
oneVsRest.fit(x_train, y_train)
y_pred = oneVsRest.predict(x_test)
# Performance metrics
accuracy = round(accuracy_score(y_test, y_pred) * 100, 2)
# Get precision, recall, f1 scores
precision, recall, f1score, support = score(y_test, y_pred, average='micro')
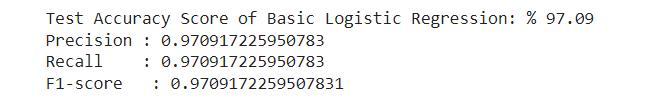
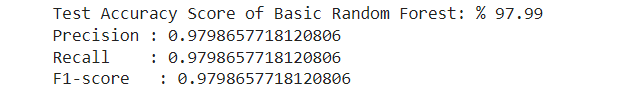
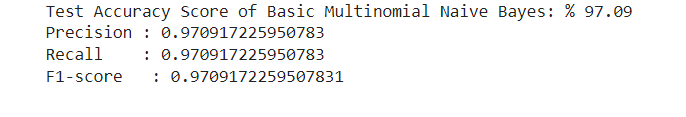
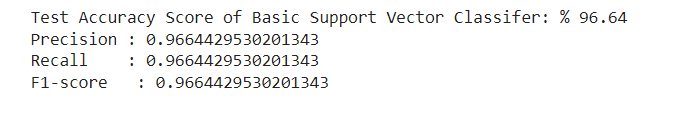
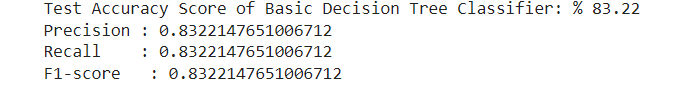
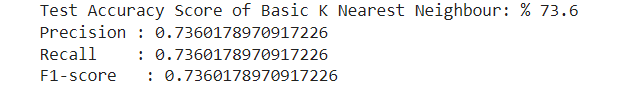
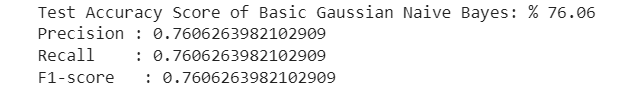
print(f'Test Accuracy Score of Basic {model_name}: % {accuracy}')
print(f'Precision : {precision}')
print(f'Recall : {recall}')
print(f'F1-score : {f1score}')
# Add performance parameters to list
perform_list.append(dict([
('Model', model_name),
('Test Accuracy', round(accuracy, 2)),
('Precision', round(precision, 2)),
('Recall', round(recall, 2)),
('F1', round(f1score, 2))
]))
run_model('Logistic Regression', est_c=None, est_pnlty=None)

run_model('Random Forest', est_c=None, est_pnlty=None)
run_model('Multinomial Naive Bayes', est_c=None, est_pnlty=None)
run_model('Support Vector Classifer', est_c=None, est_pnlty=None)
run_model('Decision Tree Classifier', est_c=None, est_pnlty=None)
run_model('K Nearest Neighbour', est_c=None, est_pnlty=None)
run_model('Gaussian Naive Bayes', est_c=None, est_pnlty=None)
model_performance = pd.DataFrame(data=perform_list)
model_performance = model_performance[['Model', 'Test Accuracy', 'Precision', 'Recall', 'F1']]
model_performance
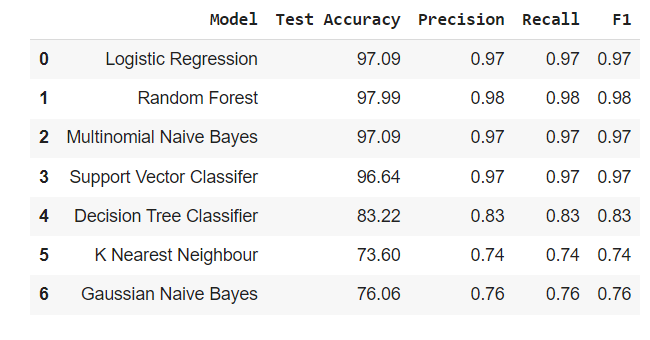
Here, after training and testing the model we find that Random Forest Classifier model has given the best accuracy from all machine learning models.
model = model_performance["Model"]
max_value = model_performance["Test Accuracy"].max()
print("The best accuracy of model is", max_value,"from Random")

Here we fit and predict our best model i.e. Random Forest.
classifier = RandomForestClassifier(n_estimators=100 ,criterion='entropy' , random_state=0).fit(x_train, y_train)
classifier
y_pred = classifier.predict(x_test)
Now, here, after the completion of model analysis, we can also predict any news articles.
y_pred1 = cv.transform(['Hour ago, I contemplated retirement for a lot of reasons. I felt like people were not sensitive enough to my injuries. I felt like a lot of people were backed, why not me? I have done no less. I have won a lot of games for the team, and I am not feeling backed, said Ashwin'])
yy = classifier.predict(y_pred1)
result = ""
if yy == [0]:
  result = "Business News"
elif yy == [1]:
  result = "Tech News"
elif yy == [2]:
  result = "Politics News"
elif yy == [3]:
  result = "Sports News"
elif yy == [1]:
  result = "Entertainment News"
print(result)

Finally after doing Data cleaning and Data Preprocessing (cleaning data, train_test_split model, creating a bag of words NLP model, and machine learning model) we got the accuracy scores and we can say that Random Forest Classification gives the best accuracy among all machine learning models.
And at last, we also predict the category of different news articles.
GitHub repository for web scraping and data preprocessing is here.
If you have any queries, please let me know here.
Read more articles on Text Classification, here.
Thank you for your time and for reading my article. Please feel free to contact me if you have any questions or would like to share your comments.
The media shown in this article is not owned by Analytics Vidhya and are used at the Author’s discretion.
Lorem ipsum dolor sit amet, consectetur adipiscing elit,
Write, captivate, and earn accolades and rewards for your work


[…] Source link […]
A text dataset is a collection of data that consists of text documents, such as articles, books, emails, social media posts, reviews, or any other form of written or typed text. Text datasets are used in various applications, including natural language processing (NLP), machine learning, and data mining. These datasets can be used to train and test various text-based models such as language models, sentiment analysis models, and text classification models. Text datasets can be sourced from various places, including web scraping, public domain books, online forums, and social media platforms.