5 Regression Algorithms You Should Know: Introductory Guide
Introduction
In machine learning, regression algorithms play a pivotal role in modeling the relationship between a dependent variable and one or more independent variables. These powerful techniques enable data scientists and analysts to make accurate predictions of numerical values, shedding light on intricate patterns and trends within datasets.
Regression analysis is often used in finance, investing, and other fields, and it finds the relationship between a single dependent variable(target variable) and several independent ones. For example, predicting house prices, the stock market, or the salary of an employee, etc, are the most common
regression problems. This article will look at the 5 types of regression algorithms.
Learning Outcomes:
- Understanding the fundamental concepts of regression analysis and its application in machine learning for predicting continuous numerical values.
- Familiarity with the characteristics of regression models.
- Recognition of the diverse applications of regression algorithms across various domains.
This article was published as a part of the Data Science Blogathon
Table of contents
What is Regression?
Regression is a statistical method used in machine learning to model and analyze the relationships between a dependent variable (output) and one or more independent variables (inputs). It aims to predict the dependent variable’s value based on the independent variables’ values.
Regression in Machine Learning
In machine learning, regression is a type of supervised learning in which the model learns from a dataset of input-output pairs. The model identifies patterns in the input features to predict continuous numerical values of the output variable. Regression algorithms help solve regression problems by finding the relationship between the data points and fitting a regression model.
Characteristics of Regression
- Dependent and Independent Variables: Regression models the relationship between the dependent and independent variables (target) (predictors).
- Regression Coefficients: These are the parameters of the regression model that are estimated from the data.
- Regression Line: In linear regression, this is the line that best fits the data points.
- Residuals: The differences between the predicted values and the actual values.
- Loss Function: Measures the model’s error. Examples include mean squared error (MSE) and mean absolute error (MAE).
- Overfitting and Underfitting: Regression models must balance complexity and simplicity to generalize well on unseen data.
- Regularization Techniques: Methods like ridge and lasso regression are used to avoid overfitting by penalizing large coefficients.
What are Regression Algorithms?
Regression algorithms are a subset of machine learning algorithms that predict a continuous output variable based on one or more input features. Regression aims to model the relationship between the dependent variable (output) and one or more independent variables (inputs). These algorithms attempt to find the best-fit line, curve, or surface that minimizes the difference between predicted and actual values.
Applications of Regression Algorithms
Regression algorithms are versatile tools used to predict continuous outcomes across various domains. Here are some detailed applications:
- Finance and Economics:
- Stock Price Prediction: Predicting future stock prices based on historical data, market trends, and economic indicators.
- Risk Management: Estimating the risk of investment portfolios and calculating Value at Risk (VaR).
- Economic Forecasting: Modeling economic indicators like GDP growth, unemployment rates, and inflation trends.
- Credit Scoring: Assessing the creditworthiness of individuals or companies by predicting default probabilities.
- Healthcare:
- Disease Progression: Predicting the progression of diseases such as diabetes or cancer based on patient history and medical data.
- Patient Outcomes: Estimating patient survival rates, recovery times, and treatment effectiveness.
- Healthcare Costs: Forecasting hospital readmission rates and healthcare expenditures.
- Marketing and Sales:
- Customer Lifetime Value (CLV) Is the total value a customer will bring to a business over the course of their relationship.
- Sales Forecasting: Predicting future sales based on historical sales data, market conditions, and promotional activities.
- Market Response Modeling: Understanding and predicting consumer responses to marketing campaigns and changes in pricing.
- Engineering and Manufacturing:
- Predictive Maintenance: Forecasting equipment failures and maintenance needs to reduce downtime and repair costs.
- Environmental Science:
- Weather Forecasting: Predicting weather conditions such as temperature, rainfall, and wind speed.
- Climate Change Modeling: Estimating the impacts of climate change on various environmental factors.
- Pollution Levels: Forecasting air and water pollution levels based on industrial activities, traffic, and meteorological data.
- Retail and E-commerce:
- Demand Forecasting: Predicting future product demand to optimize inventory levels and supply chain management.
- Price Optimization: Estimating the optimal pricing strategy to maximize revenue and profit.
- Transportation and Logistics:
- Delivery Time Estimation: Forecasting delivery times in logistics and supply chain operations based on various factors, such as distance, traffic, and weather conditions.
Benefits and Drawbacks of Regression Algorithms
Benefits:
- Simplicity: Many regression algorithms, especially linear regression, are easy to understand and implement.
- Interpretability: Regression models, particularly linear ones, provide clear insights into the relationships between variables.
- Efficiency: Regression algorithms can be computationally efficient, particularly for linear models.
- Versatility: Applicable to a wide range of problems across different fields.
- Predictive Power: Can be very accurate for predicting continuous outcomes when the model is well-fitted.
Drawbacks:
- Overfitting: Complex models (e.g., polynomial regression) can overfit the training data, capturing noise instead of the underlying pattern.
- Underfitting: Simple models may underfit the data, failing to capture important patterns.
- Assumptions: Many regression methods rely on assumptions (e.g., linearity, normality, independence of errors) that may not hold for all datasets.
- Sensitivity to Outliers: Outliers can heavily influence regression models, leading to inaccurate predictions.
- Multicollinearity: When independent variables are highly correlated, it can cause instability in the coefficient estimates.
- Scalability: Some regression techniques (e.g., neural network regression) can become computationally expensive with large datasets.
List of Top 5 Regression Algorithms
Here is a list of top 5 regression algorithms
- Linear Regression
- Decision Tree
- Support Vector Regression
- Lasso Regression
- Random Forest
Linear Regression
Linear Regression is an ML algorithm used for supervised learning. It predicts a dependent variable(target) based on the given independent variable(s). This regression technique reveals a linear relationship between a dependent variable and the other given independent variables. Hence, the name of this algorithm is linear regression. It has two types: simple linear regression and multiple linear regression.
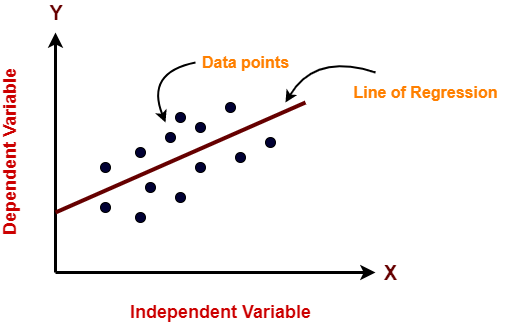
In the figure above, the independent variable is on the X-axis, and the output is on the Y-axis. The regression line is the best-fit line for a model, and our main objective in this algorithm is to find this best-fit line.
Pros:
- Linear Regression model is simple to implement.
- Less complexity compared to other algorithms.
- Linear Regression may lead to over-fitting, but it can be avoided by using some dimensionality reduction techniques, regularization techniques, and cross-validation.
Cons:
- Outliers affect this algorithm badly.
- A linear regression model oversimplifies real-world problems by assuming a linear relationship among the variables; hence, it is not recommended for practical use cases.
Decision Tree
Tree models can be applied to all data containing numerical and categorical features. Decision trees are good at capturing the non-linear interaction between the features and the target variable. Decision trees somewhat match human-level thinking, so understanding the data is very intuitive.
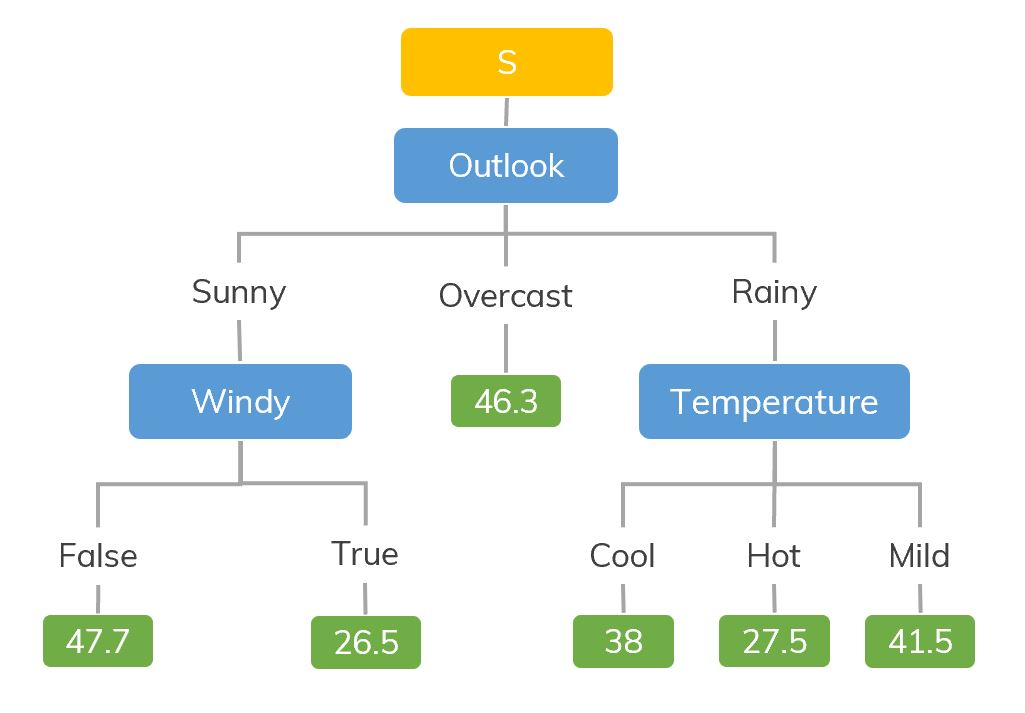
Source: https://dinhanhthi.com
For example, if we classify how many hours a kid plays in particular weather, the decision tree looks somewhat like this above in the image.
So, in short, a decision tree is a tree where each node represents a feature, each branch represents a decision, and each leaf represents an outcome(numerical value regression).
Pros:
- Easy to understand and interpret, visually intuitive.
- It can work with numerical and categorical features.
- It requires little data preprocessing: there is no need for one-hot encoding, dummy variables, etc.
Cons:
- It tends to overfit.
- A small change in the data tends to cause a big difference in the tree structure, which causes instability.
Implementation
import numpy as np
from sklearn.tree import DecisionTreeRegressor
rng = np.random.RandomState(1)
X = np.sort(5 * rng.rand(80, 1), axis=0)
y = np.sin(X).ravel()
y[::5] += 3 * (0.5 - rng.rand(16))
# Fit regression model
regr = DecisionTreeRegressor(max_depth=2)
regr.fit(X, y)
# Predict
X_test = np.arange(0.0, 5.0, 1)[:, np.newaxis]
result = regr.predict(X_test)
print(result)

Output:
[ 0.05236068  0.71382568  0.71382568  0.71382568 -0.86864256]
Support Vector Regression
You must have heard about SVM, i.e., Support Vector Machine. SVR also uses the same idea as SVM, but it tries to predict the real values here. This algorithm uses hyperplanes to segregate the data. If this separation is impossible, it uses the kernel trick, where the dimension is increased, and then the data points become separable by a hyperplane.
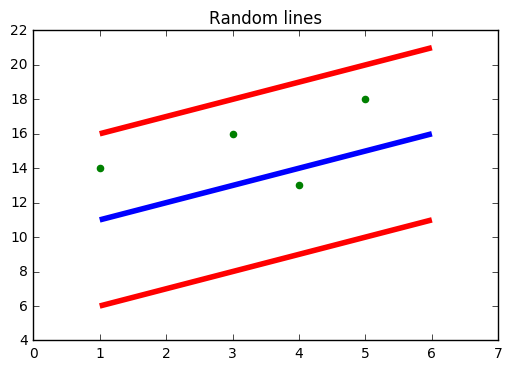
Source: https://www.medium.com
In the figure above, the Blue line is the hyperplane; the Red Line is the Boundary Line.
All the data points are within the boundary line(Red Line). SVR’s main objective is to consider only those points within the boundary line.
Pros:
- Robust to outliers.
- Excellent generalization capability
- High prediction accuracy.
Cons:
- Not suitable for large datasets.
- They do not perform very well when the data set has more noise.
Implementation
from sklearn.svm import SVR
import numpy as np
rng = np.random.RandomState(1)
X = np.sort(5 * rng.rand(80, 1), axis=0)
y = np.sin(X).ravel()
y[::5] += 3 * (0.5 - rng.rand(16))
# Fit regression model
svr = SVR().fit(X, y)
# Predict
X_test = np.arange(0.0, 5.0, 1)[:, np.newaxis]
svr.predict(X_test)
Output:
array([-0.07840308,  0.78077042,  0.81326895,  0.08638149, -0.6928019 ])
Lasso Regression
LASSO stands for Least Absolute Selection Shrinkage Operator is one of the simplest classification algorithm. Shrinkage is a constraint on attributes or parameters. This classification algorithm operates by finding and applying a constraint on the model attributes that causes the regression coefficients for some variables to shrink toward zero. Variables with a regression coefficient of zero are excluded from the model.
So, lasso regression analysis is a shrinkage and variable selection method that helps to determine which predictors are most important.
Pros:
- It avoids overfitting
Cons:
- LASSO will select only one feature from a group of correlated features
- Selected features can be highly biased.
Implementation
from sklearn import linear_model
import numpy as np
rng = np.random.RandomState(1)
X = np.sort(5 * rng.rand(80, 1), axis=0)
y = np.sin(X).ravel()
y[::5] += 3 * (0.5 - rng.rand(16))
# Fit regression model
lassoReg = linear_model.Lasso(alpha=0.1)
lassoReg.fit(X,y)
# Predict
X_test = np.arange(0.0, 5.0, 1)[:, np.newaxis]
lassoReg.predict(X_test)
Output:
array([ 0.78305084,  0.49957596,  0.21610108, -0.0673738 , -0.35084868])
Random Forest Regressor
Random Forests are an ensemble(combination) of decision trees. They are a Supervised Learning algorithm used for classification and regression. The input data is passed through multiple decision trees. The algorithm executes by constructing a different number of decision trees at training time and outputting the class, that is, the mode of the classes (for classification) or mean prediction of the individual trees.
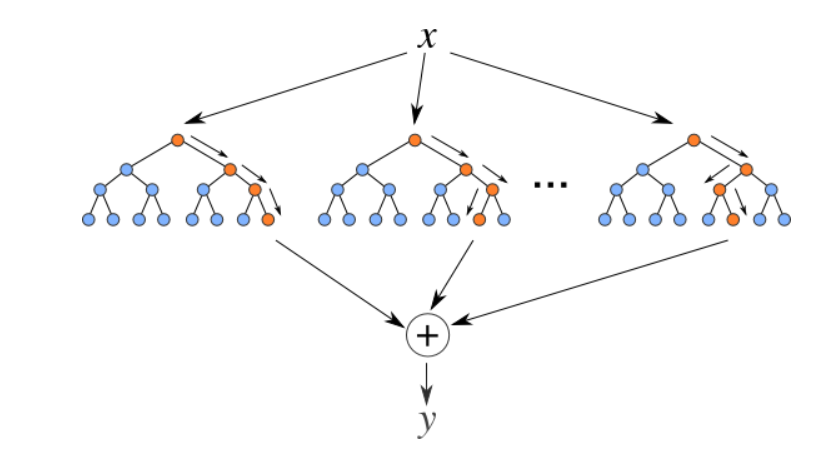
Source: https://levelup.gitconnected.com
Pros:
- Good at learning complex and non-linear relationships
- Very easy to interpret and understand
Cons:
- They are prone to overfitting
- Using larger random forest ensembles to achieve higher performance reduces their speed and requires more memory.
Implementation
from sklearn.ensemble import RandomForestRegressor
from sklearn.datasets import make_regression
X, y = make_regression(n_features=4, n_informative=2, random_state=0, shuffle=False)
rfr = RandomForestRegressor(max_depth=3)
rfr.fit(X, y)
print(rfr.predict([[0, 1, 0, 1]]))

Output:
[33.2470716]
Conclusion
Regression algorithms are indispensable tools in the data science arsenal. They enable researchers and practitioners to unravel the intricate relationships between variables and make informed predictions. From linear regression’s simplicity to the versatility of ensemble methods, these techniques equip analysts with diverse approaches to tackle a wide range of regression problems.
However, the effectiveness of regression algorithms hinges on careful feature engineering, data preprocessing, and model selection. Metrics such as mean squared error (MSE), root mean squared error (RMSE), and R-squared serve as critical benchmarks for evaluating model performance and guiding the iterative optimization process.
As data sources grow in size and complexity, developing more sophisticated regression algorithms will remain a focal point for the machine-learning community. By leveraging the power of regression analysis, researchers and practitioners can unlock valuable insights, drive informed decision-making, and push the boundaries of predictive analytics across diverse domains.
The media shown in this article are not owned by Analytics Vidhya and is used at the Author’s discretion.
Frequently Asked Questions
A. Examples of regression algorithms include Linear Regression, Polynomial Regression, Ridge Regression, Lasso Regression, Elastic Net Regression, Support Vector Regression (SVR), Decision Tree Regression, Random Forest Regression, and Gradient Boosting Regression. These algorithms are used to predict continuous numerical values and are widely applied in various fields such as finance, economics, and engineering.
A. Regression algorithms are used to predict continuous numerical values based on input features. They are widely applied in various fields, such as finance for stock price forecasting, economics for predicting economic indicators, healthcare for disease progression estimation, and engineering for product performance prediction. Regression analysis helps uncover relationships between variables and make informed predictions for future data points.
A. The commonly used algorithm for linear regression is Ordinary Least Squares (OLS). OLS finds the best-fitting line by minimizing the sum of the squared differences between the observed values and the predicted values. This results in a linear equation that best describes the relationship between the dependent and independent variables.
A. Linear regression predicts continuous outcomes and models a linear relationship between the dependent and independent variables. Logistic regression, on the other hand, is used for binary classification problems and models the probability of a binary outcome using a logistic function, resulting in outputs between 0 and 1.


I really enjoyed this post! It was informative and I learned a lot. Thank you for writing it.