SweetViz Library – EDA in Seconds
Human beings are visual creatures, It means that the human brain processes image 60,000 times faster than text, and 90 percent of information transmitted to the brain is visual. Visual information makes it easier to collaborate, and generate new ideas that impact organizational performance. That’s the only reason that data analyst spends their maximum time in data visualization.
Introduction to EDA :
EDA is a data analysis process, where multiple techniques are used to better understand the dataset being used. It is basically used to identify a human error, missing values, or outliers. It extracts useful variables and removes useless variables. It is used to understand the relationship between variables or features. It ultimately maximizes your insights into a dataset and minimizes potential errors later in the process.
What is SweetViz Library?
SweetViz Library is an open-source Python library that generates beautiful, high-density visualizations to kickstart EDA with just two lines of code. Output is a fully self-contained HTML application. The system is built around quickly visualizing target values and comparing datasets. Its goal is to help quick analysis of target characteristics, training vs testing data, and other such data characterization tasks.
Some of the features of SweetViz Library
- It shows how a target value(dependent features) relates to other features.
- It integrates associations for numerical (Pearson’s correlation), categorical (uncertainty coefficient), and categorical-numerical (correlation ratio) datatypes seamlessly, to provide maximum information for all data types.
- It automatically detects numerical, categorical, and text features, with optional manual overrides.
- Summary information about the type, unique values, missing values, duplicate rows, most frequent values.
- Numeric Analysis such as min/max/range, quartiles, mean, mode, standard deviation, sum, median absolute deviation, coefficient of variation, kurtosis, skewness.
Installation :
pip install sweetviz
Dataset Description :
Here I have used House Price Prediction Dataset. You can download it from here.
Here’s a brief version of what you’ll find in the data description file.
- SalePrice – the property’s sale price in dollars. This is the target variable that you’re trying to predict.
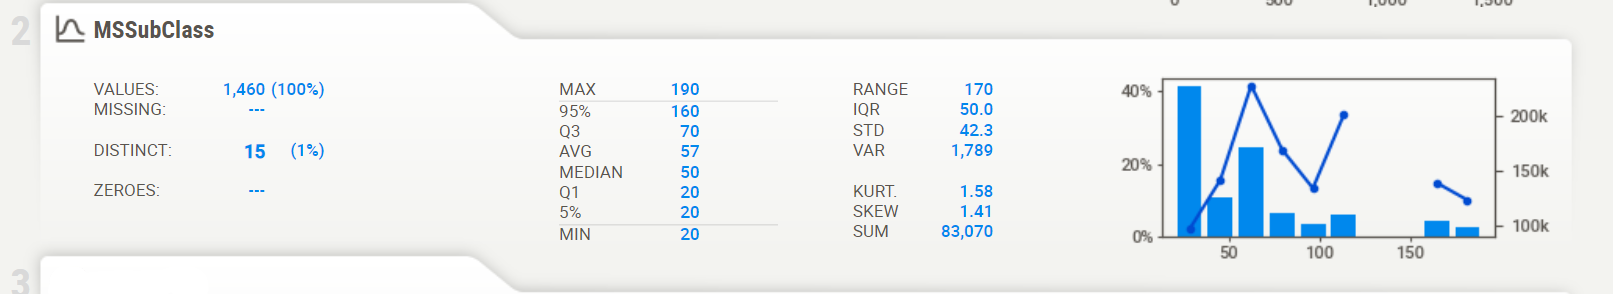
- MSSubClass: The building class
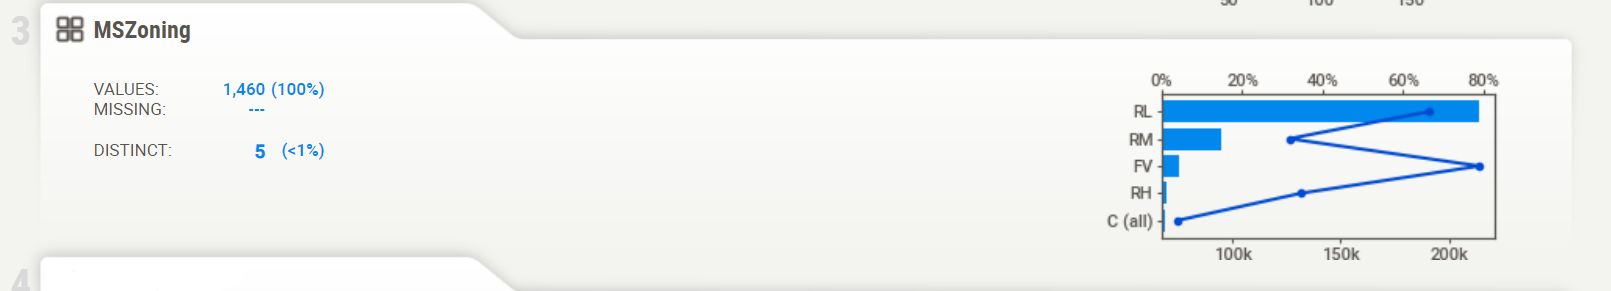
- MSZoning: The general zoning classification
- LotFrontage: Linear feet of street-connected to the property
- LotArea: Lot size in square feet
- Street: Type of road access
- Alley: Type of alley access
- LotShape: General shape of the property
- LandContour: Flatness of the property
- Utilities: Type of utilities available
- LotConfig: Lot configuration
- LandSlope: Slope of property
- Neighborhood: Physical locations within Ames city limits
- Condition1: Proximity to main road or railroad
- Condition2: Proximity to main road or railroad (if a second is present)
- BldgType: Type of dwelling
- HouseStyle: Style of dwelling
- OverallQual: Overall material and finish quality
- OverallCond: Overall condition rating
- YearBuilt: Original construction date
- YearRemodAdd: Remodel date
- RoofStyle: Type of roof
- RoofMatl: Roof material
- Exterior1st: Exterior covering on house
- Exterior2nd: Exterior covering on house (if more than one material)
- MasVnrType: Masonry veneer type
- MasVnrArea: Masonry veneer area in square feet
- ExterQual: Exterior material quality
- ExterCond: Present condition of the material on the exterior
- Foundation: Type of foundation
- BsmtQual: Height of the basement
- BsmtCond: General condition of the basement
- BsmtExposure: Walkout or garden level basement walls
- BsmtFinType1: Quality of basement finished area
- BsmtFinSF1: Type 1 finished square feet
- BsmtFinType2: Quality of second finished area (if present)
- BsmtFinSF2: Type 2 finished square feet
- BsmtUnfSF: Unfinished square feet of basement area
- TotalBsmtSF: Total square feet of basement area
- Heating: Type of heating
- HeatingQC: Heating quality and condition
- CentralAir: Central air conditioning
- Electrical: Electrical system
- 1stFlrSF: First Floor square feet
- 2ndFlrSF: Second floor square feet
- LowQualFinSF: Low quality finished square feet (all floors)
- GrLivArea: Above grade (ground) living area square feet
- BsmtFullBath: Basement full bathrooms
- BsmtHalfBath: Basement half bathrooms
- FullBath: Full bathrooms above grade
- HalfBath: Half baths above grade
- Bedroom: Number of bedrooms above basement level
- Kitchen: Number of kitchens
- KitchenQual: Kitchen quality
- TotRmsAbvGrd: Total rooms above grade (does not include bathrooms)
- Functional: Home functionality rating
- Fireplaces: Number of fireplaces
- FireplaceQu: Fireplace quality
- GarageType: Garage location
- GarageYrBlt: Year garage was built
- GarageFinish: Interior finish of the garage
- GarageCars: Size of garage in car capacity
- GarageArea: Size of garage in square feet
- GarageQual: Garage quality
- GarageCond: Garage condition
- PavedDrive: Paved driveway
- WoodDeckSF: Wood deck area in square feet
- OpenPorchSF: Open porch area in square feet
- EnclosedPorch: Enclosed porch area in square feet
- 3SsnPorch: Three season porch area in square feet
- ScreenPorch: Screen porch area in square feet
- PoolArea: Pool area in square feet
- PoolQC: Pool quality
- Fence: Fence quality
- MiscFeature: Miscellaneous feature not covered in other categories
- MiscVal: $Value of miscellaneous feature
- MoSold: Month Sold
- YrSold: Year Sold
- SaleType: Type of sale
- SaleCondition: Condition of sale
Let’s begin :
### importing required libraries
import pandas as pd
import sweetviz
### reading training dataset
train = pd.read_csv("train.csv")
### reading testing dataset
test = pd.read_csv("test.csv")
Let’s analyze our dataset using Sweetviz Library :
my_report = sweetviz.analyze([train, "Train"],target_feat='SalePrice')
Here “sweetviz.analyze()” is just a function that analyzes the data frame and we have to pass the target feature as a parameter. Always remember the parameters should be in form of a list. You can check out the documentation and play with different parameters.
Let’s see the whole report :
### create a whole report in form of HTML file
my_report1.show_html('Report.html')
Whenever you will hover on a particular feature, it will show full detail about that feature. I hover on the dependent feature and look at what I got.
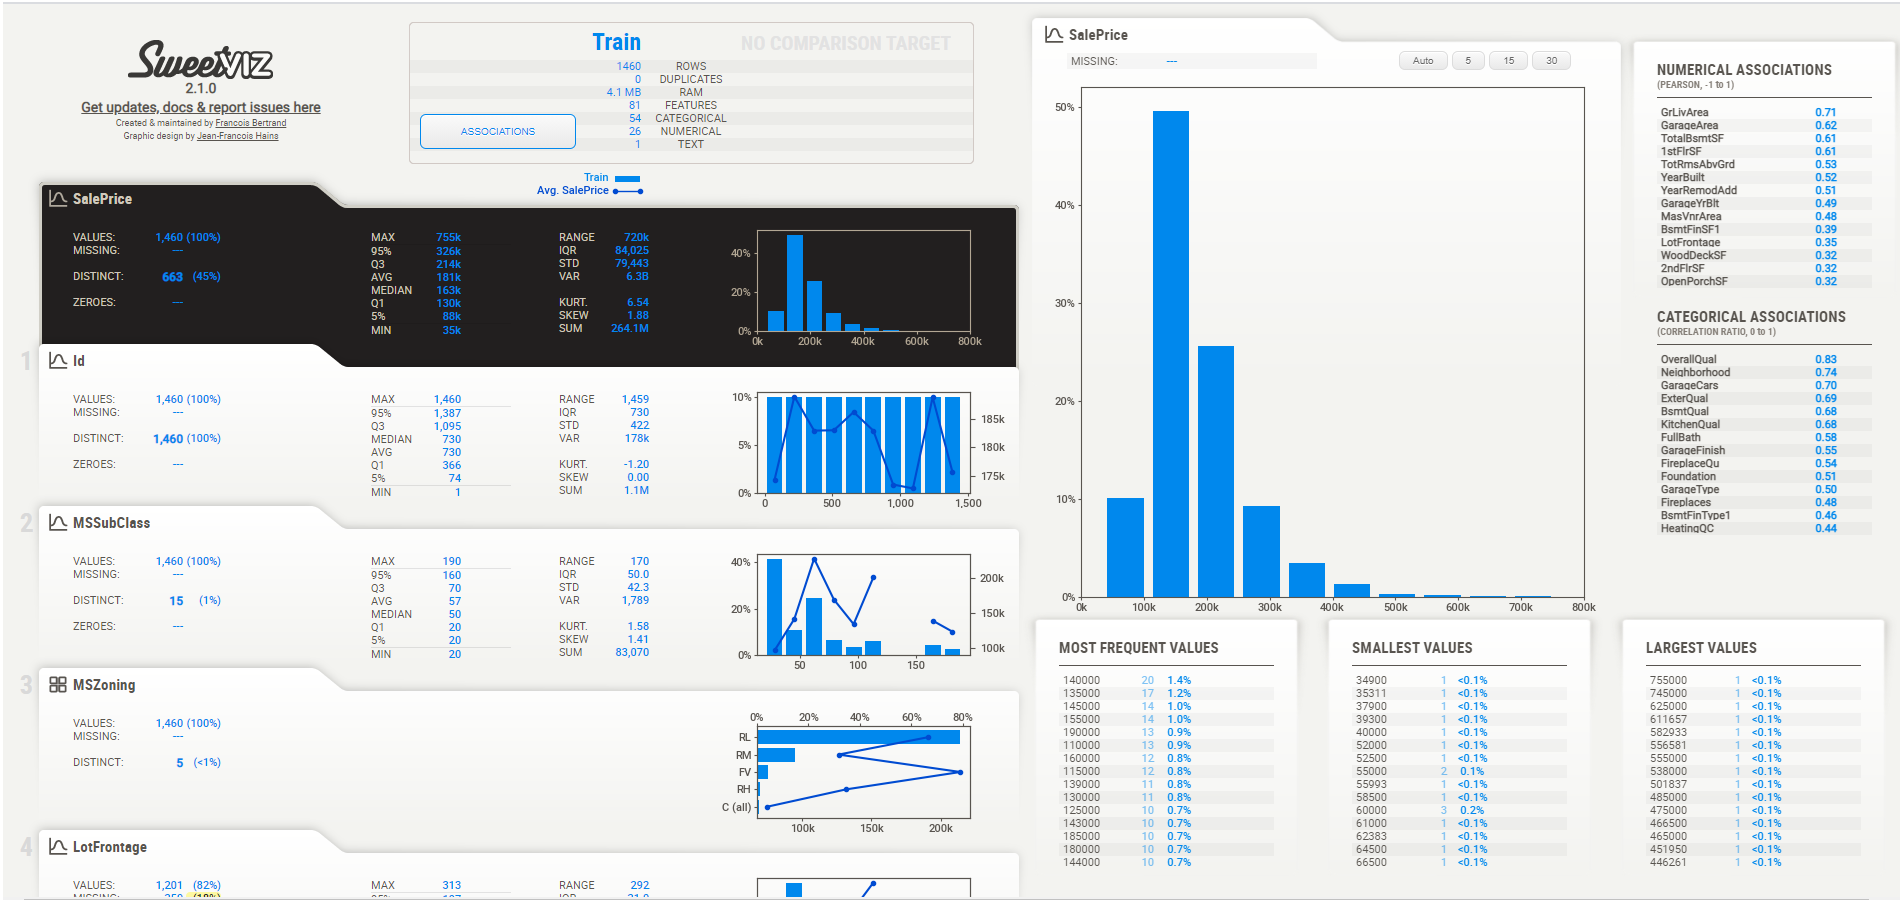
Here dependent feature is highlighted in black color and on the right-hand side full information about the dependent variable is mentioned. All the information about the dataset is basically shown in this HTML file. If our input features are numeric features then sweetviz will show these details.
In the case of categorical features, it will show these details.
Association: Hovering our mouse over the “Associations” button in the summary will make the Associations’ graph appear on the left-hand side.
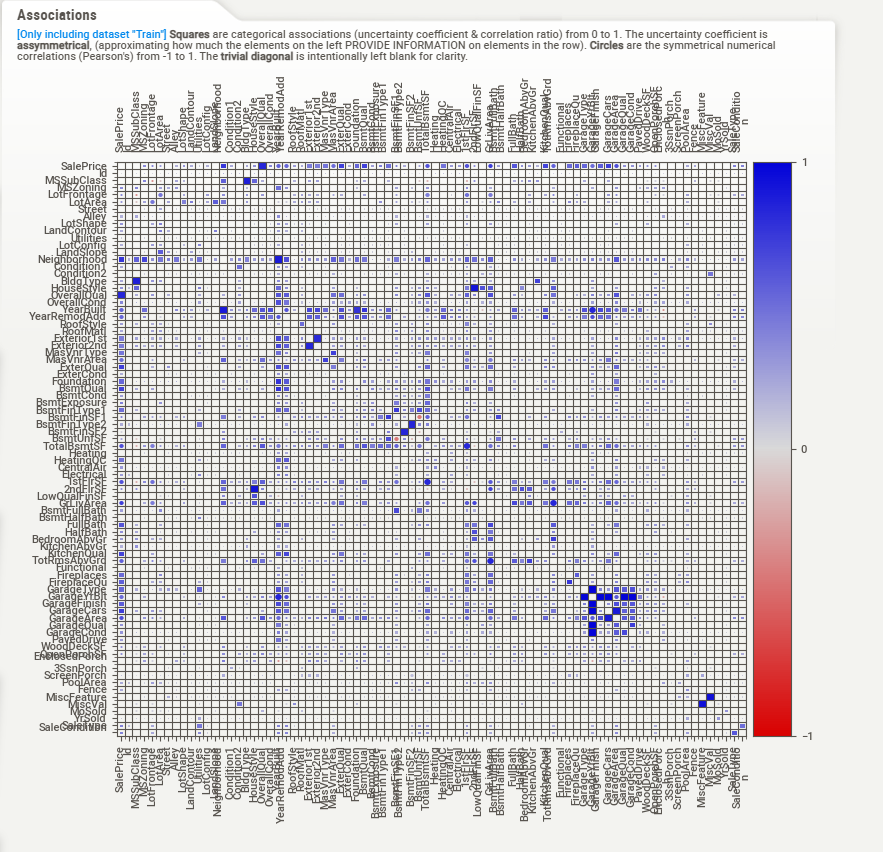
Here in this problem statement, we are using a huge dataset and it took only somewhere around 10 to 12 seconds to visualize the whole dataset.
Let’s compare the Training and Testing dataset using Sweetviz :
### in case of testing data pass seperate list for testing data as parameter
my_report1 = sweetviz.compare([train, "Train"], [test, "Test"], "SalePrice")
my_report.show_html('Report2.html')
For your better understanding, I have added long screenshots. In the case of comparing training and testing data each and every feature is compared with testing data. Whenever you will perform it practically that time you will understand it in a better way.
Conclusion
It easily gives us a significant jump-start when you start looking at a new dataset. It’s worth pointing out I also find it useful later in the analysis process, for example during feature generation, to get a quick overview of how new features play out.
EndNote
I hope you enjoyed this article. Any question? Have I missed something? Please reach out on my LinkedIn or drop a response below. And finally, … it doesn’t go without saying,
Thank you for reading!
Cheers!
Ronil
SweetViz Library is an open-source Python library that generates beautiful, high-density visualizations to kickstart EDA with just two lines of code.


