
If I had a magic wand, I would want to add scenario evaluation to all business intelligence tools on the market. I have previously written about the need to make intelligent decisions with decision intelligence. The data and analytics markets have evolved so that organizations have far greater capabilities to utilize data in decision-making processes. While there is some convergence around the concept of decision intelligence, there are still several “islands” of decision-making. Analyzing historical data to understand what happened and why it happened is a very mature market segment. And while artificial intelligence and machine learning require specialized skills and technologies, interest and capabilities in this segment are spilling over into BI, but are mostly separate. Driver-based planning capabilities are another island of decision-making, largely independent of BI tools. Without driver-based planning, how can an organization effectively evaluate various scenarios that result from the actions it might take based on analysis of the organization’s performance?
Unfortunately, most of this analysis is probably happening in spreadsheets today. Our Analytics and Data Benchmark Research shows 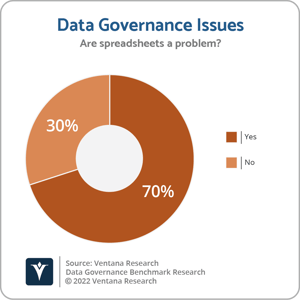 that three-quarters of organizations use spreadsheets in data and analytics processes. Spreadsheets are great tools for ad hoc analyses, but we know the perils of relying on spreadsheets. Our Data Governance Benchmark Research also shows nearly the same number (70%) of organizations report that spreadsheets are a data governance issue. What organizations need are better tools for scenario evaluation.
Scenario evaluation should include several steps to be effective and exceed gut-based decision-making. The critical component ‒ and the one missing from most BI tools ‒ is the ability to create projections of what might happen in the future. Often these are financial projections, but they can also be operational projections. The projections are based on mathematical formulas which form a model of the business and its operations. For example, in a manufacturing business, the model would involve quantities of inputs or raw materials, labor needed, production rates and outputs from a given data set. In a real estate business, a model would involve occupancy or vacancy rates, rent per unit or square foot, cost of financing, maintenance costs, commissions and advertising to attract tenants. However, one projection is rarely sufficient. The point is to evaluate different scenarios and compare possible outcomes. At a minimum, several projections should be created using different sets of inputs. The comparison may be between alternatives ‒ such as increasing advertising and its anticipated benefits compared with hiring more business development representatives making outbound calls. The comparison may be between optimistic, pessimistic and most likely scenarios. Regardless of the comparison, the process involves applying knowledge of how the business operates ‒ in the form of the model ‒ with different sets of inputs.
The next step in the process is to compare the results of different projections. Typically, the comparison involves financial results associated with each scenario. In other cases, the comparison may involve measures such as production output or quality. In public sector agencies, it may include the number of people served or the percentage of funds distributed to beneficiaries. These types of comparisons are the bread and butter of BI tools. As long as the data is available, the software can provide tables, charts and other metrics from the comparisons.
Two key features are missing from today’s tools: modeling that provides projections and data input capabilities. Most BI tools rely on SQL or some variant. SQL is not very flexible for creating the computations needed for projections. Intra-row calculations are simple, but inter-row calculations common in spreadsheet models are more difficult to express. Multidimensional expressions (or MDX) is more capable in this regard with functions such as LEAD, LAG and the ability to reference relative or absolute positions in hierarchies and dimensions.
Regardless of the modeling language, tools must provide a way to collect, store and process data input. By definition, this data doesn’t exist yet. New inputs and values are created and tested to see how well they address the emerging situation. It could easily involve many values, such as monthly or weekly inputs across a variety of elements in the model. Yet, most BI tools have limited mechanisms to collect input. In many cases, the only option is to use a dialog box or form. Input tools should support copying values to all time periods or growing inputs by a certain amount each time period. That’s pretty easy to do in a spreadsheet but impossible in most BI tools.
The last piece of the puzzle is scenario management, which supports the creation and management of multiple data sets associated with the same model. It often begins by copying an existing set of data and modifying some of the elements. After tweaking the data, this new scenario can be saved and evaluated. It should be easy to create scenarios and just as easy to delete them to encourage exploration of alternative data sets. However, the system architecture needs to minimize bloat caused by generating many scenarios. One way to minimize bloat is to calculate projections on the fly rather than storing calculations in the database. However, such a calculation engine must be able to provide nearly instantaneous results, otherwise users will become frustrated and limit exploration of alternatives, resulting in subpar decision-making.
I’ll give extra credit for ways to incorporate risk or expected value of each of the scenarios. Sometimes, the highest possible outcome is also the riskiest alternative. Organizations should be able to assess risk-adjusted results.  Perhaps businesses prefer 80% of the maximum attainable output with a very high level of confidence rather than risking the likelihood of a lower outcome.
We assert through 2025, less than one-third of analytics vendors will include driver-based planning capabilities, making decision intelligence more difficult. Until BI tools incorporate more of these capabilities, organizations must consider a separate set of planning tools to apply discipline to this process. Alternatively, many will continue to resort to spreadsheets, even with all their flaws, to evaluate different scenarios.
Regards,
David Menninger
Authors:

David Menninger
Executive Director, Technology Research
David Menninger leads technology software research and advisory for Ventana Research, now part of ISG. Building on over three decades of enterprise software leadership experience, he guides the team responsible for a wide range of technology-focused data and analytics topics, including AI for IT and AI-infused software.