article thumbnail

Open-Source BI Tool Metabase for Data Visualization and Analytics

Analytics Vidhya

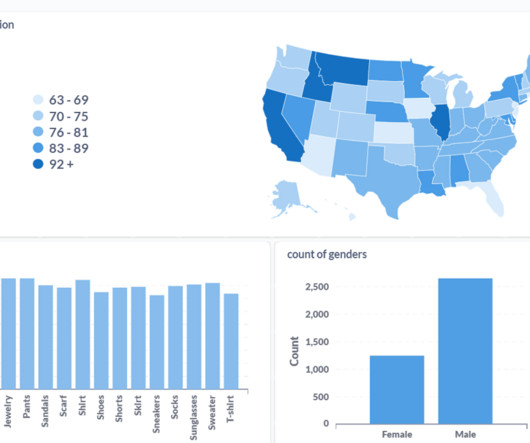
Try Metabase, an open-source Business Intelligence (BI) tool for creating interactive dashboards from large datasets. Learning […] The post Open-Source BI Tool Metabase for Data Visualization and Analytics appeared first on Analytics Vidhya. Introduction Are you a passionate data professional exploring new tools?

article thumbnail

Qlik Advances Self-Service Analytics and Business Intelligence

David Menninger's Analyst Perspectives

The analytics and business intelligence market landscape continues to grow as more organizations seek robust tools and capabilities to visualize and better understand data. BI systems are used to perform data analysis, identify market trends and opportunities and streamline business processes.

Insiders

Sign Up for our Newsletter

This site is protected by reCAPTCHA and the Google Privacy Policy and Terms of Service apply.

Trending Sources

article thumbnail

6 Top Tools for Analytics and Business Intelligence in 2020

Analytics Vidhya

Overview Analytics and Business Intelligence provide comprehensible view of the company and derive actionable insights. We’ll discuss 6 top business intelligence tools that you. The post 6 Top Tools for Analytics and Business Intelligence in 2020 appeared first on Analytics Vidhya.

article thumbnail

A Guide To Starting A Career In Business Intelligence & The BI Skills You Need

datapine

4) Business Intelligence Job Roles. Do you find computer science and its applications within the business world more than interesting? If you answered yes to any of these questions, you may want to consider a career in business intelligence (BI).In So, what skills are needed for a business intelligence career?

article thumbnail

A Practical Guide to Business Intelligence Governance

Speaker: Marius Moscovici, CEO Metric Insights & Mike Smitheman, VP Metric Insights

While the proper governance of data is clearly critical to the success of any business intelligence organization, focusing on data governance alone is a huge mistake. To be effective, Business Intelligence (BI) governance must cover both data and visualizations.

article thumbnail

Tableau Brings Business Intelligence to Business Users

David Menninger's Analyst Perspectives

Organizations are collecting vast amounts of data every day, utilizing business intelligence software and data visualization to gain insights and identify patterns and errors in the data. Making sense of these patterns can enable an organization to gain an edge in the marketplace and plan more strategically.

article thumbnail

Visualize Your Data With Google Looker Studio

Analytics Vidhya

Data in itself is not useful unless we present it in a meaningful way and derive insights that help in making key business decisions. Business Intelligence (BI) tools serve the […]. The post Visualize Your Data With Google Looker Studio appeared first on Analytics Vidhya.

article thumbnail

Monetizing Analytics Features: Why Data Visualizations Will Never Be Enough

Think your customers will pay more for data visualizations in your application? But today, dashboards and visualizations have become table stakes. Five years ago they may have. Discover which features will differentiate your application and maximize the ROI of your embedded analytics. Brought to you by Logi Analytics.