Top 15 Warehouse KPIs & Metrics For Efficient Management
The use of big data and analytics technologies has become increasingly popular across industries. Every day, more and more businesses realize the value of analyzing their own performance to boost strategies and achieve their goals. This is no different in the logistics industry, where warehouse managers track a range of KPIs that help them efficiently manage inventory, transportation, employee safety, and order fulfillment, among others.
With the help of the right logistics analytics tools, warehouse managers can track powerful metrics and KPIs and extract trends and patterns to ensure everything is running at its maximum potential. But how do you know which indicators to track?
To help you in your journey to achieve warehousing excellence, we put together this insightful guide on warehouse KPIs. Keep on reading to learn a definition, benefits, and a warehouse KPI list with the most prominent examples any manager should be tracking to achieve operational success.
Let’s dive in with the definition.
What Is A Warehouse KPI?
A Warehouse KPI is a measurement that helps warehousing managers to track the performance of their inventory management, order fulfillment, picking and packing, transportation, and overall operations. It allows for informed decision-making and efficient risk mitigation.
With the help of the right KPI tools, managers can not only get a real-time view of their warehouse performance but also go deeper into the data and extract powerful insights to improve their strategies, boost productivity, and use resources smartly. Making the use of warehousing metrics a huge competitive advantage.
That said, it is important to note that even though most warehouse management KPIs can be applied to any warehouse, each business operates with different goals and objectives. Therefore, it is very important to pick your indicators based on your actual needs. We will dive deeper into this point later in the post. Now, let’s look at some benefits to keep putting the power of warehouse key performance indicators into perspective.
Why Do You Need Warehouse KPIs?
Now that you know the definition of warehouse KPIs, let’s look at some of the benefits you can reap from using them to evaluate your performance.
- Informed decision-making: The biggest benefit of using KPIs and metrics in your warehousing strategies is informed decision-making. Being able to inform your strategies with actual facts instead of intuition will enable you to optimize your resources and ensure you are continuously improving.
- Time and cost efficiency: In business, saving as much time and money as possible is of the essence. Making decisions based on your performance will help you avoid wasting monetary and time resources on wrong strategies. With the power of data, you can boost your warehouse efficiency at the lowest possible cost.
- Boost customer satisfaction: By making informed decisions using powerful metrics, you’ll be able to offer the best shopping experience to your customers with permanent stock, short delivery times, and no surprises. In time, this will help you increase customer satisfaction and skyrocket warehouse ROI.
- Enhance efficiency and safety: Ensuring your warehouse operations are efficient and safe is another great benefit of using KPIs. These powerful measurements will allow you to track all activities in real-time to ensure everything runs smoothly and safely.
Explore our modern KPI software for 14 days, completely free!
Top Warehouse KPIs Examples & Templates
The daily operation of a warehouse involves many processes, technologies, and people working simultaneously to ensure all steps are completed successfully. Across the day, products coming from different suppliers and production centers are received and stored in storage facilities with the help of machines and technology. At the same time, other products are picked from storage, carefully packed, and loaded into a transportation vehicle to be sent to the end customer or to a store to be sold.
With so many processes, products being handled, and resources being spent, ensuring everything runs smoothly and efficiently is paramount. That is where warehouse metrics and KPIs come into play. These measurements allow managers and other relevant warehouse stakeholders to closely monitor the performance of all the aforementioned processes to not only ensure they are running as expected but also to extract more profound conclusions that can help boost efficiency even further.
To help you keep making sense of the value of these indicators, we’ve put together a list of the top 15 warehouse performance metrics you should track and divided them into the main sections of warehouse management. We arrenged these 15 warehouse KPIs into 4 main categories: inventory, order management, pick and pack as well as transportation. Lets get started!
I. Inventory
Inventory metrics are measurements that help you monitor and evaluate the stock level in your warehouse. They help accurately plan production levels and make smart strategic decisions to boost revenue. Let’s look at some examples below.
1) Inventory accuracy
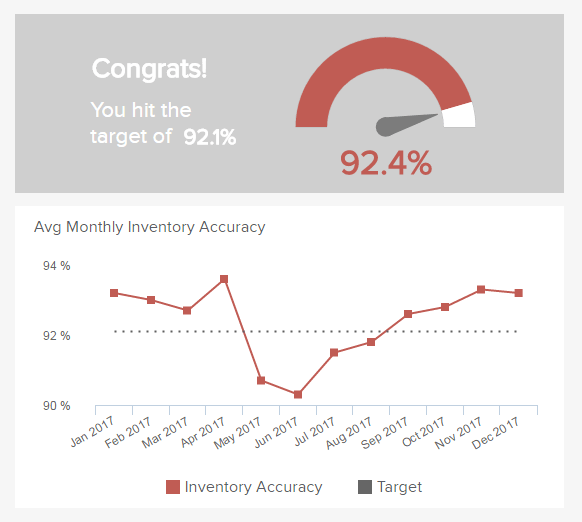
The first KPI for warehouse and logistics that we will cover in this list is inventory accuracy. Considered one of the most critical metrics for inventory management, it monitors that the level of inventory that has been tracked in the system matches the one physically stored in the warehouse.
Even though most warehouses use automated systems to track their inventory levels, a mismatch can still happen due to various factors, including theft, damaged products, miscalculations, or even shortages from the supplier.
The consequences of a low inventory accuracy rate can turn into higher costs for the business, an increase in back orders, and a lower customer satisfaction rate, as some customers might not receive their products due to a lack of physical stock. For that reason, it is of utmost importance to keep this rate as high as possible. As seen in the image above, setting a target based on your historical performance and your accuracy efforts is a great way to approach the process.
2) Inventory carrying costs
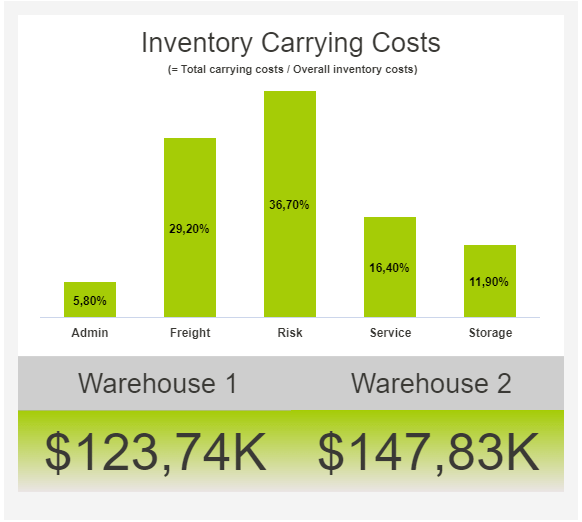
As its name suggests, the inventory carrying costs is a warehouse KPI sample that tracks the costs associated with storing unsold inventory. As seen in the image above, these costs can include employee salaries, taxes, insurance, storage, and even the investment opportunities that the business might be losing due to having a lot of resources tight to inventory.
The inventory carrying costs are considered one of the biggest challenges for efficient warehouse management as they directly affect profitability. The longer the inventory stays in storage, the higher the cost for the warehouse. Therefore, it is important to define the amount of time the business can afford to keep that inventory before thinking of strategies to get rid of it.
Among the many strategies and technologies organizations use to keep these costs at a minimum, predictive analytics is one of the most effective ones. By analyzing historical demand, they can forecast the inventory level they will need and avoid having high levels of unsold products.
3) Inventory turnover
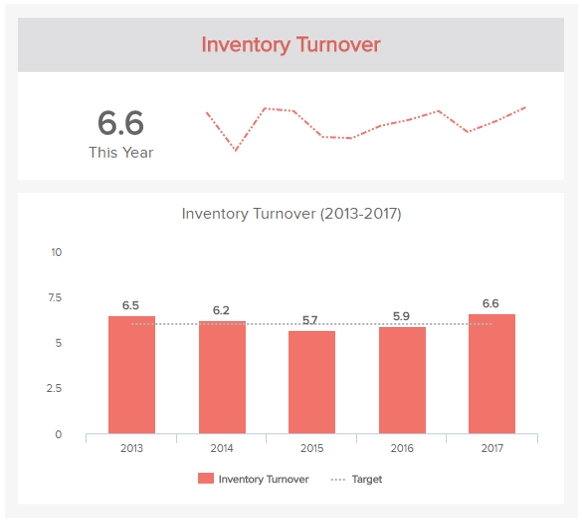
Next, in our warehouse metrics examples, we have the inventory turnover. This KPI tracks the number of times you sold your entire inventory over an observed period. Meaning that the higher the turnover, the higher the sales, and the lower the turnover, the lower the sales. A high inventory turnover also means the business is good at predicting demand and promoting its products.
It is important to note that there is no unique benchmark for this KPI as it will vary from industry to industry. For example, a warehouse storing cars might have a lower turnover than one storing sneakers. Therefore, it is important to only compare yourself to other companies in the same industry.
Just like with the previous KPI, applying forecasting technologies to predict demand and streamlining your inventory management strategies is a good way to keep this rate in check.
4) Inventory to sales ratio
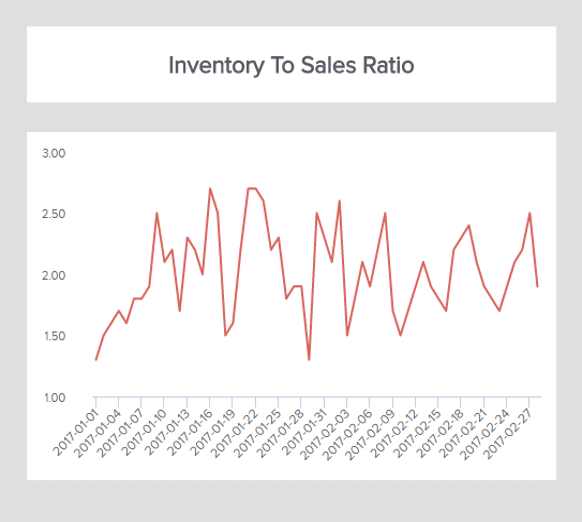
The inventory to sales ratio is a KPI for warehouse and logistics that helps you identify overstock levels. It measures the ratio between your available inventory for sale and the amount that has actually been sold over an observed period. Warehouse managers use this indicator to identify potential cash flow issues and plan the level of stock needed to avoid dealing with unsold products and a low inventory turnover.
A good practice is to visualize this and other inventory KPIs together in an online dashboard to get a complete picture of your inventory management strategies. You can devise a realistic target and track it regularly to track any improvements or other relevant insights.
II. Order Management
Probably the most important section of these warehouse KPI examples is order management. It tracks all the processes that take place from the moment a customer places an order to the moment they receive it and everything that comes in between. That is why the warehouse metrics templates we will present below are mostly influenced by other factors, such as picking and packing or delivery times, to name a few.
5) Order cycle time
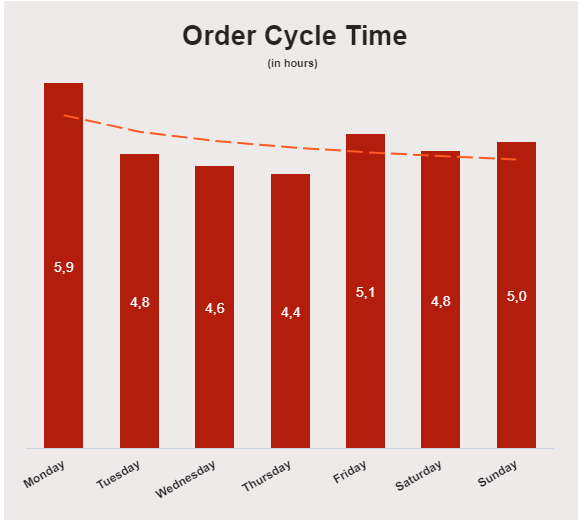
The first of our warehouse KPIs templates for order management is the order cycle time. It measures the average time it takes to ship an order from the moment it was placed to the time it leaves the warehouse, without considering the shipping time.
What makes this KPI so valuable is its high influence on customer satisfaction, as customers highly value their orders arriving on time. Any inefficiencies found during the analysis of this indicator can help boost customer engagement and loyalty by offering short delivery times with no unexpected surprises.
As a standalone metric, the order cycle time does not provide as many insights. A further look into other indicators, such as the picking accuracy or the average dwell time, can help you get a deeper understanding of the reasons for a higher or lower order cycle time. As we discussed with other examples on this list, setting a realistic target for this KPI is a great practice.
6) On-time shipping
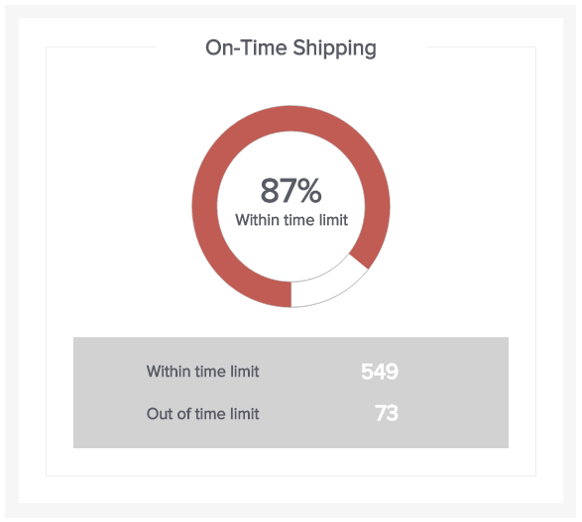
As its name suggests, this straightforward KPI for warehouse management tracks the ratio of total orders that have been shipped before or on the date they were supposed to. It is calculated by dividing the total number of orders by the orders shipped on time.
As expected, you want to keep this ratio as high as possible, as it directly influences customer satisfaction and engagement. A lower ratio means your warehouse is suffering from efficiency issues, which can lead to orders being late, among other issues.
The average time to ship an order might vary from product to product. Therefore, it is essential to test different benchmarks and see what works best for your business.
7) Perfect order rate
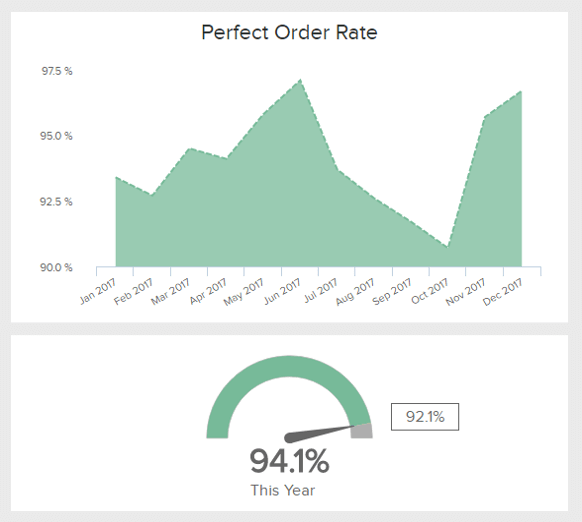
The perfect order rate is probably one of the most important warehouse metrics that come to mind when thinking about efficient order management. As its name suggests, it tracks the percentage of orders that are shipped and fulfilled without any incidents, such as inaccuracies, damaged products, shipping delays, or even packages getting lost in transit.
The consequences of a low perfect order rate are significant costs to the company in managing returns and damaged orders but, most importantly, damages to customer satisfaction and the overall company reputation. Something that can prevent customers from coming back to purchase again and recommend your company to their friends.
A good way to reach your expected perfect order rate is to closely monitor each stage of the order management process and attack any inefficiencies as soon as they are detected. As seen in the image above, you can track it monthly and against a target to measure its development more realistically.
8) Back order rate
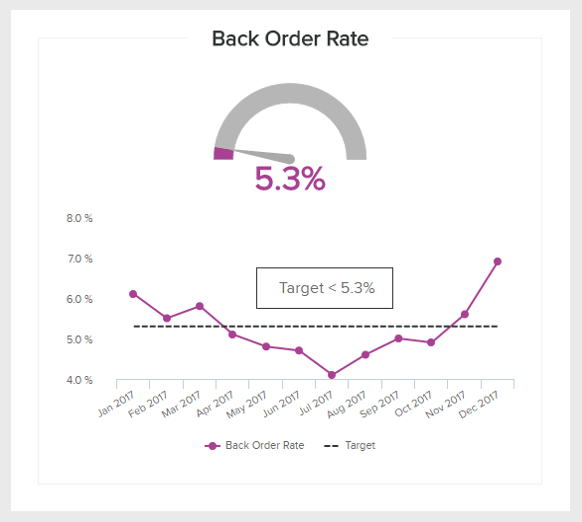
The last of our warehouse productivity metrics related to order management is the back order rate. It measures the ratio of your total orders that can not be fulfilled at the time the customer placed the order.
This metric can become tricky to analyze if you don’t consider its context. A high back order rate can shine a light on inefficiencies in your warehouse processes but also an unexpected rise in product demand. A decreasing back order rate can mean efficient strategies but lower sales. That is why it should always be looked at from the specific context of the organization instead of a standalone value.
Visualizing this KPI together with the inventory accuracy or the out-of-stock ratio in a professional logistics dashboard is a great way to get the 360-degree view needed to understand if the back order rate is positive, negative, or nothing to worry about.
Explore our modern KPI software for 14 days, completely free!
III. Pick and Pack
As its name suggests, picking and packing in a logistics warehouse refers to the process in which a worker or machine finds an item in the warehouse, picks it from storage, and packs it up to be sent to the end customer. The examples below are all about optimizing the pick and pack process to make it as efficient and cost-effective as possible.
9) Picking accuracy
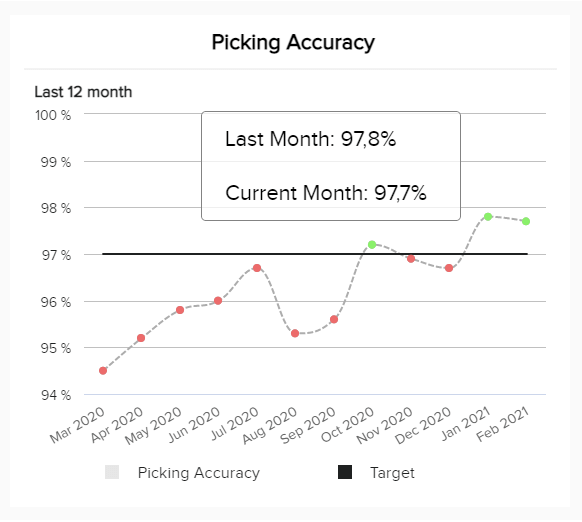
The first warehouse management KPI of this section is picking accuracy. It measures the percentage of orders that are picked without errors from your total number of orders. A low picking accuracy means a higher rate of return and higher costs in managing wrongly shipped items. It can also damage customer satisfaction, which can lead to a decrease in sales.
As seen in the image above, you can track this rate monthly against a set target. Tracking it every month can help you see if your picking strategies are having any impact or if something needs to be fixed. You can also do random checks in your warehouse to see if the picking process is running smoothly.
10) Pick and pack cycle time
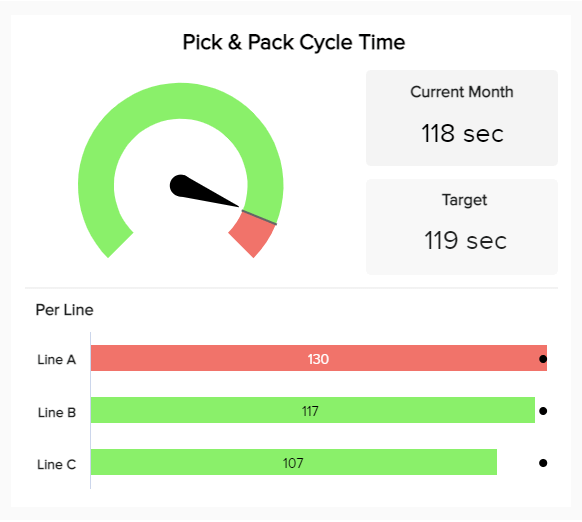
The pick and pack cycle time is a logistics warehouse KPI that measures the average time in seconds it takes a warehouse employee to pick an item from the shelf to the time the item is packed and ready to be shipped. It is calculated by dividing the total amount of time by the total number of items picked and packed in a set period.
Achieving a perfect picking and packing cycle time is all about testing. In the image above, we can see that this business tracks the KPI for three different lines of work. Lines B and C are below the maximum target of 119 seconds, while line A is around 10 seconds above. That means something must be fixed in that line to ensure maximum efficiency.
The value of tracking this metric for different lines of work is that you can test different strategies and see which one works best—giving you the flexibility to test different technologies and ideas.
11) Pick and pack costs
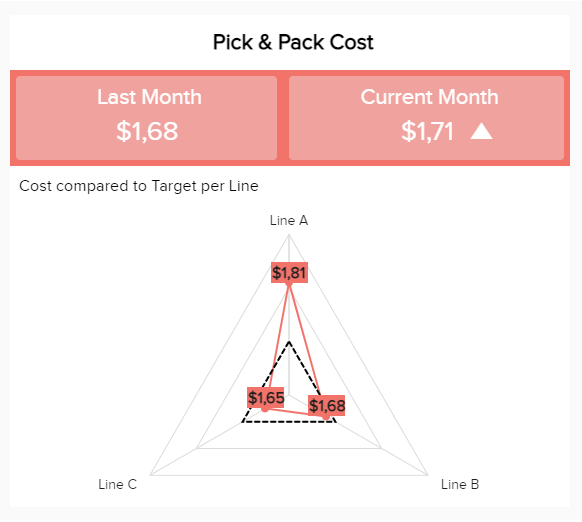
Moving on with our list of warehouse performance measures, we have the pick and pack costs. As you probably figured by its name, it tracks all costs related to the pick and pack process, including employee salaries, packaging materials, and equipment.
Just like all other warehousing processes, you want to keep the picking and packing costs to a minimum. This can be achieved by implementing smart strategies that make the process as smooth as possible.
As in the previous example, you can measure this KPI for different lines of work to get a detailed picture of all costs. You can also track it for different products or product categories to understand where your costs are going up and what areas need improvement.
12) Use of packaging material
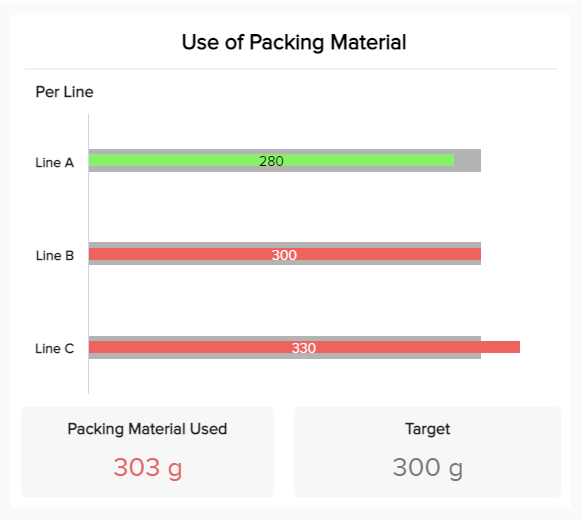
The use of packaging material tracks the amount of materials being used to pack orders in each line of work of your warehouse. It is an important metric to track not only because it can help reduce pick and pack costs but mostly because of the environmental impact these materials can have.
For a few years now, businesses have started to reduce the sizes of their packages and invested in more environmentally friendly materials to ensure their environmental impact is as low as possible. This has also become a priority for customers who often call out brands for unnecessarily big packaging.
A good practice to keep the use of materials in check is to set mandatory package dimensions in relation to the size of the product being packed. That way, you’ll avoid employees packing small items in huge boxes.
IV. Transportation
The last section of warehouse performance indicators that we will cover in this post is transportation. This is the last step in the order management process, and it involves metrics related to the efficiency of the delivery stage. These are very important indicators to track, as inefficiencies can affect shipping times and customer satisfaction.
13) Dwell time
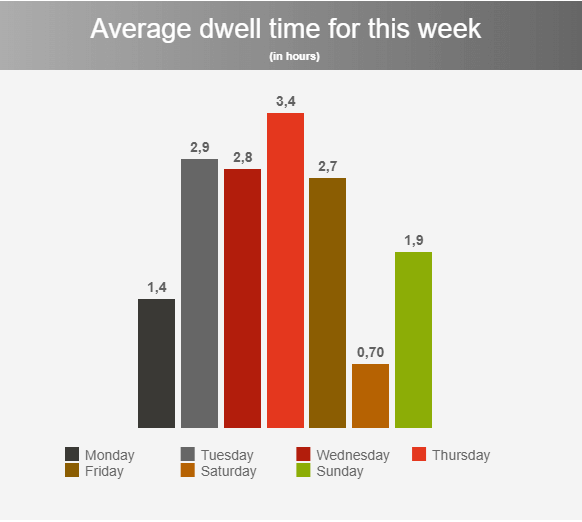
Also known as “detention time”, the dwell time is a warehouse KPI that tracks the average time in hours drivers spend in the warehouse waiting for the orders to be loaded or unloaded from the trailer.
It is a great indicator to track as all the processes that come before need to be aligned to ensure the orders that have to be delivered make it into the trailer as fast as possible. There are various reasons why this indicator can go to the higher side, including vehicle delays, loading complex or heavy orders, tedious check-in processes, and order volume, among others.
That being said, while there are techniques and strategies you can apply to prevent dwell time, having some level of it is unavoidable, and it should be considered in your shipping times.
14) Transportation costs
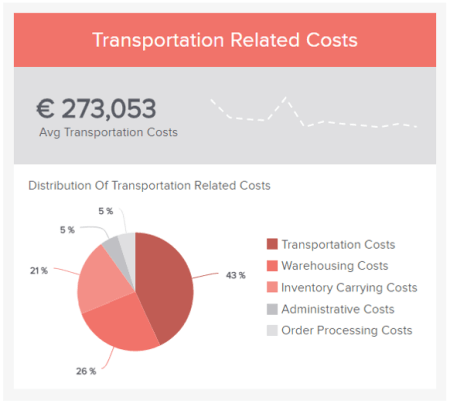
Another cost-related KPI, the transportation costs, breaks down all the costs associated with processing an order, including administrative costs and carrying costs of inventory. Tracking this indicator closely is valuable as it can let you analyze the costs of each stage of the process and see what could be optimized to lower costs without sacrificing delivery efficiency.
A good practice is to also calculate this metric for specific products. That way, you can see how much transporting an item costs you compared to the revenue it brings.
15) Trailer utilization rate
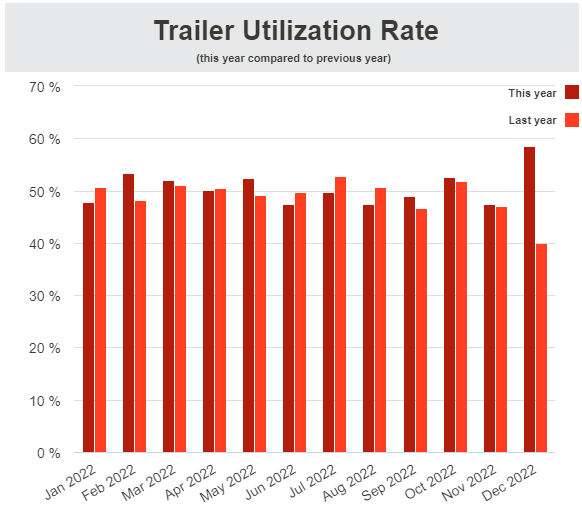
Last but not least, in our warehouse metrics examples, we have the trailer utilization rate. It measures the percentage of space that is being utilized in your trailers every month. Monitoring this KPI regularly can help you maximize your trailer space to the fullest while decreasing costs associated with extra fuel and unnecessary wear and tear of the vehicles. Plus, by carrying out a detailed analysis of your trailer utilization rate, you can realize that you might not need as many trailers as you have, which can also decrease costs considerably.
That being said, ensuring all orders are ready to be loaded into the trailer and shipped to the customers is not always easy. Therefore, you need to test different strategies and evaluate their effectiveness.
Visualize All Your KPIs Together In A Professional Warehouse Dashboard
As you learned through the list of warehouse KPI examples that we presented above, these measurements are highly valuable to provide businesses with the needed knowledge to optimize their strategies and ensure efficient warehouse operations.
That being said, most of them need to be analyzed together to get the best insights out of them, as all processes in the warehouse are tight to each other. Analyzing all your KPIs together will help you tell a story and extract the true potential of your warehouse data. And that is done through the use of professional dashboard software.
Dashboards are interactive and visually appealing tools that provide a centralized view of a business's most important key performance indicators. The value of a warehouse dashboard lies in its ability to provide a 360-degree view of historical and current data to make accurate decisions. Below, we present you a template that covers a couple of the KPIs that we described earlier in the post.
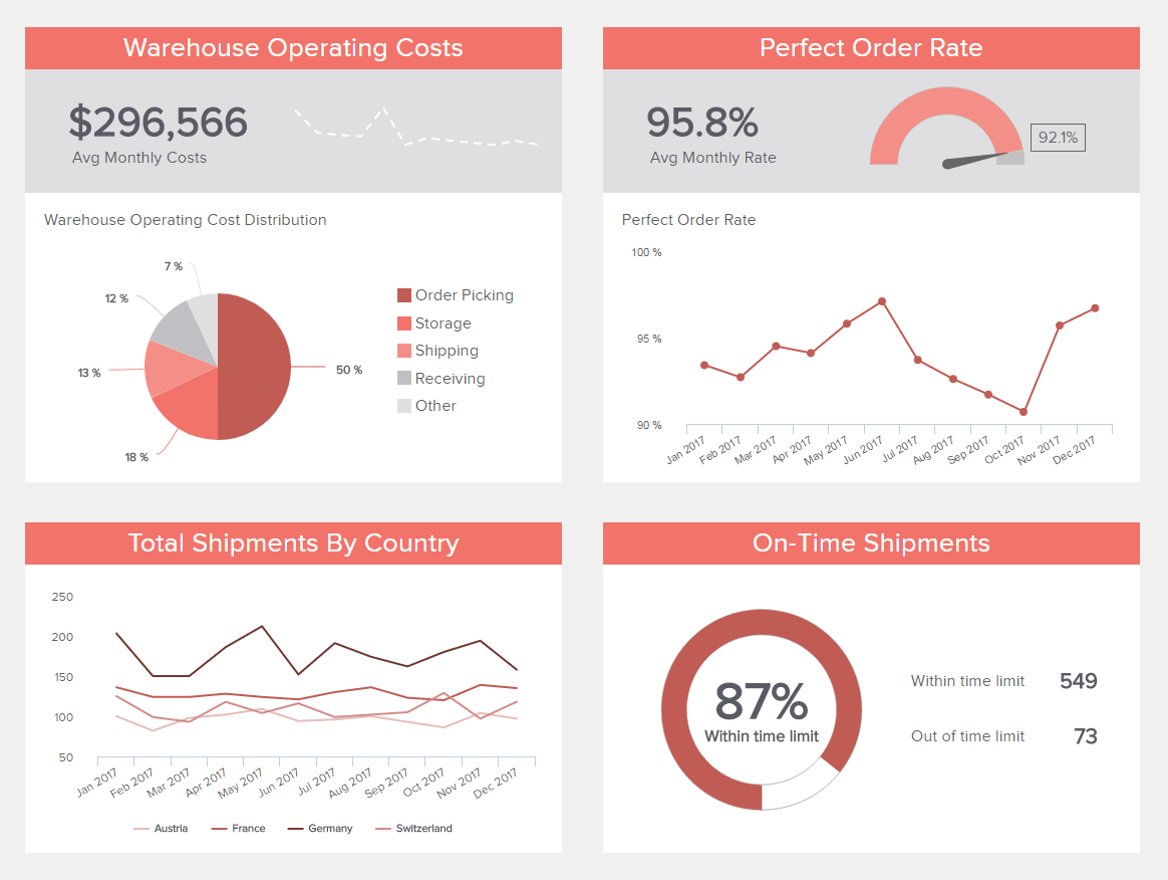
**click to enlarge**
Explore our modern KPI software for 14 days, completely free!
Key Takeaways From Warehouse Management KPIs
The world of data and analytics is here to stay. Using your own business data to inform your strategies and boost growth can turn into a huge competitive advantage, and KPIs are the secret weapon to achieve it.
Using the right mix of warehousing metrics and KPIs can make a difference in your daily operations and resource management. These measurements help you track every detail of your performance and put you in a position to find improvement opportunities and discover trends and patterns that will help you take your strategies to the next level.
Using a professional dashboard creator to assemble everything and tell a compelling story will empower every relevant stakeholder to integrate data into their daily operations. Boosting collaboration, communication, and overall efficiency.
To help you keep your mind fresh, here is a summary of the top warehouse KPIs examples:
- Inventory accuracy
- Carrying costs of inventory
- Inventory turnover
- Inventory to sales ratio
- Order cycle time
- On-time shipping
- Perfect order rate
- Rate of return
- Pick and pack cycle time
- Picking accuracy
- Pick and pack costs
- Use of packaging material
- Dwell time
- Transportation costs
- Trailer utilization rate
If you are ready to start generating your own warehouse metrics, then try our professional KPI dashboard software for a 14-day free trial and benefit from advanced data analytics!