Remove Dashboards Remove Metadata Remove Structured Data Remove Visualization
article thumbnail

How to get powerful and actionable insights from any and all of your data, without delay

Cloudera

By enabling their event analysts to monitor and analyze events in real time, as well as directly in their data visualization tool, and also rate and give feedback to the system interactively, they increased their data to insight productivity by a factor of 10. . Our solution: Cloudera Data Visualization.

article thumbnail

How gaming companies can use Amazon Redshift Serverless to build scalable analytical applications faster and easier

AWS Big Data

Sources Data can be loaded from multiple sources, such as systems of record, data generated from applications, operational data stores, enterprise-wide reference data and metadata, data from vendors and partners, machine-generated data, social sources, and web sources.

Insiders

Sign Up for our Newsletter

This site is protected by reCAPTCHA and the Google Privacy Policy and Terms of Service apply.

Trending Sources

article thumbnail

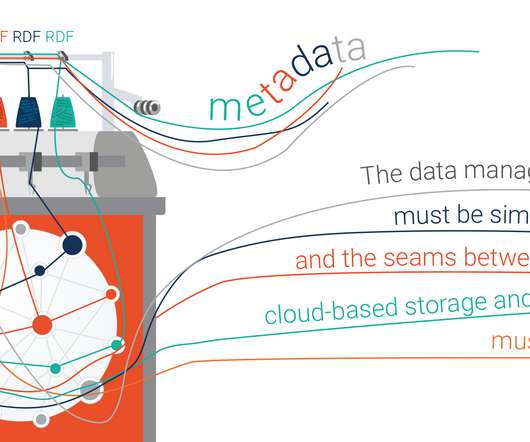
From Data Silos to Data Fabric with Knowledge Graphs

Ontotext

The Data Fabric paradigm combines design principles and methodologies for building efficient, flexible and reliable data management ecosystems. Knowledge Graphs are the Warp and Weft of a Data Fabric. To implement any Data Fabric approach, it is essential to be able to understand the context of data.

article thumbnail

Data Lakes on Cloud & it’s Usage in Healthcare

BizAcuity

Data lakes are centralized repositories that can store all structured and unstructured data at any desired scale. The power of the data lake lies in the fact that it often is a cost-effective way to store data. Data in healthcare industry can be broadly classified into two sources: clinical data and claims data.

Data Lake 102
article thumbnail

Exploring real-time streaming for generative AI Applications

AWS Big Data

Streaming jobs constantly ingest new data to synchronize across systems and can perform enrichment, transformations, joins, and aggregations across windows of time more efficiently. OpenSearch Service offers visualization capabilities powered by OpenSearch Dashboards and Kibana (1.5

article thumbnail

Top 10 Key Features of BI Tools in 2020

FineReport

Overall, as users’ data sources become more extensive, their preferences for BI are changing. They prefer self-service development, interactive dashboards, and self-service data exploration. To put it bluntly, users increasingly want to do their own data analysis without having to find support from the IT department.

article thumbnail

Create an end-to-end data strategy for Customer 360 on AWS

AWS Big Data

Profile aggregation – When you’ve uniquely identified a customer, you can build applications in Managed Service for Apache Flink to consolidate all their metadata, from name to interaction history. Then, you transform this data into a concise format. Data exploration Data exploration helps unearth inconsistencies, outliers, or errors.