


What We’ve Covered
Throughout the One Big Cluster Stuck series we’ve explored impactful best practices to gain control of your Cloudera Data platform (CDP) environment and significantly improve its health and performance. We’ve shared code, dashboards, and tools to help you on your health improvement journey. We’d like to provide one last tool.
The Environmental Health Scorecard
We track environment health at the macro level with a dashboard that mirrors our blog series methodology with a few additions. We set quarterly OKR (Objectives and Key Results) targets to improve our score.
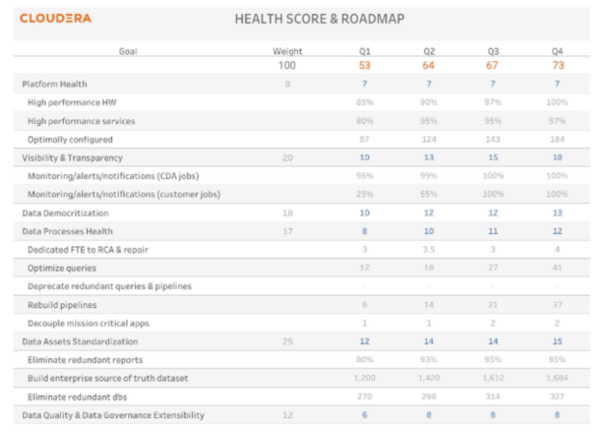
At lower levels of grain our measurements are data-driven and automated, but at the macro level we prefer to apply some subjectivity (of course our weightings will differ from yours as we are on a different journey). Our data and analytics leaders meet monthly to evaluate our health improvement and log subjective measures. Some may call that anecdotal evidence but we value the pairing of our data-driven analysis with our observable reality.
Platform Health
It all starts with platform health which we chose to measure in 3 dimensions: hardware performance, services performance, and optimal configuration/tuning. We provided dozens of how-to manuals to gain visibility and tune your environment.
Is it surprising that we weighted platform health only an 8 on a 100 point scale? Our model considers the duration and resource commitment required to complete 80% of the journey, and since our platform optimization took only a few resources a few months, we weighted it low. If you’ve got a multiyear platform journey ahead of you, you’ll weigh it more heavily.
NOTE: The Optimally configured number is just a count of tunings we completed, and the percentages are subjective evaluations.
Visibility and Transparency
Weighted a 20?! Yup. It’s that important to us as we have written. We chose separate measures for our own jobs and our users’ jobs. With 100% monitoring, alerting (notifications to DevOps), and notifications (to our customers), why didn’t we earn a 20? Because we weren’t as proactive in resolving issues as our OKR targets indicated we should be.
Data Democratization
Although we did not blog about data democratization, we find it an important measure of environmental health. Every other measurement is meaningless if critical data elements are unavailable to decision makers. Incidentally, this measure is in the opposite seat of the see-saw as the others: ungoverned data democratization is the single greatest cause of all the problems we’re trying to impact. Think about that.
Data Process Health
Although we did not devote a blog to this health measure, we provided numerous instructions to repair problems you find. The goals we chose in the dashboard are important to us, but choose those that are important to you. The individual scores are counts but the overall health score is not a sum, it’s subjective. This is a multiyear journey.
Data Asset Standardization
This measure gets our highest weighting at 25 out of 100. The health of the environment is most dependent on the trust that users have in the data. The greater your data observability, and the greater the volume that is accessed via enterprise standard dashboards and governance-certified sources of truth, the greater the opportunity for trust. The trust develops through an understanding of the data as maintained through metadata in your Data Catalog: classification, lineage, currency, and business context . You can see that we did great on report standardization but we have longer to go to certify our enriched datasets and data marts, and to repipe our users’ assets. Another multiyear journey.
Data Quality & Data Governance Extensibility
Like data standardization this goes to the heart of trusted data. We have 37 total health points measuring data trustworthiness. That may seem counterintuitive when applied to an environmental “health” measure, but that’s how we see it. You may see these and other measures differently.
Best of Luck!
We smile at the possibility that we might have enabled you to be more efficient or capable (or both!). Visit our Community Page, our blogs, and Data and IT Leaders page for so much more.
Editor's Choice

