Introducing The Five Pillars Of Data Journeys
“There are those who discover they can leave behind destructive reactions and become patient as the earth, unmoved by fires of anger or fear, unshaken as a pillar, unperturbed as a clear and quiet pool.”
– Gautama Buddha
When your data team is in crisis from errors in production, complaining customers, and uncaring data providers, we all wish we could be unshaken as the Buddha. Our recent survey showed that 97% of data engineers report experiencing burnout in their day-to-day jobs. Perhaps we could just chill out in those stressful situations and “let go,” as the Buddha suggests. The spiritual benefits of letting go may be profound, but finding and fixing the problem at its root is, as Samuel Florman writes, “existential joy.”
Finding problems before your customers know they exist helps your team’s happiness, productivity, customer trust, and customer data success. Given the complicated distributed systems we use to get value from data and the diversity of data, we need a simplifying framework. That idea is the Data Journey. In an era where data drives innovation and growth, it’s paramount that data leaders and engineers understand and monitor their Data Journey’s various facets. The key to success is the capability to understand and monitor the health, status, and performance of your data, data tools, pipeline, and infrastructure, both at a macro and micro level. Failures on the Data Journey cost organizations millions of dollars.
Putting the Data Journey idea into five pillars is a great way to organize and share the concept. The table below gives an overview:

| Across The Steps | Down The Stack | Data In Place | Data In Use | Set Expectations | |
| Where is it | You have databases, ETL/ELT tools, BI/Visualization Tools, predictive models, and governance. | Your data analytics in servers, software, disk, and from various code/config. | Data at rest in a Database, bucket store, files, etc. | Data in use in BI/Visualization Tools, predictive models, and export/reverse ETL | You want to know what is wrong, where it is, quickly delivered in the right place |
| What is Checked and Observed? | Check Runs, Order Of Operations, Schedule | Monitor Metrics, Logs, And Cost | Validate Data Quality Automatically With Business Domain Tests | Test The Results Of Models, Visualization, Delivery, And Utilization | Compare Expected Against Reality, Alert, Analyze |
| Examples | Orchestrator Schedule, Overlapping Jobs, Delays | Error Message, Server CPU, Disk Size, Run Cost | Schema, Freshness, Volume; Percentage Regional Sales Growth | Root Means Square Error From Model; PowerBI Dashboard Values | Order of steps, timing, data test results, costs, metrics |
| Value | Process Reliability | Technology Status | Data Quality | End User Experience | Incident Alerting |
Table Summarizing the Five Data Journey Pillars.
Another way to look at the five pillars is to see them in the context of a typical complex data estate. You may have four steps your data takes from its source to customer use, or twenty. However, every Data Journey spans many ‘little boxes’ like the diagram below.
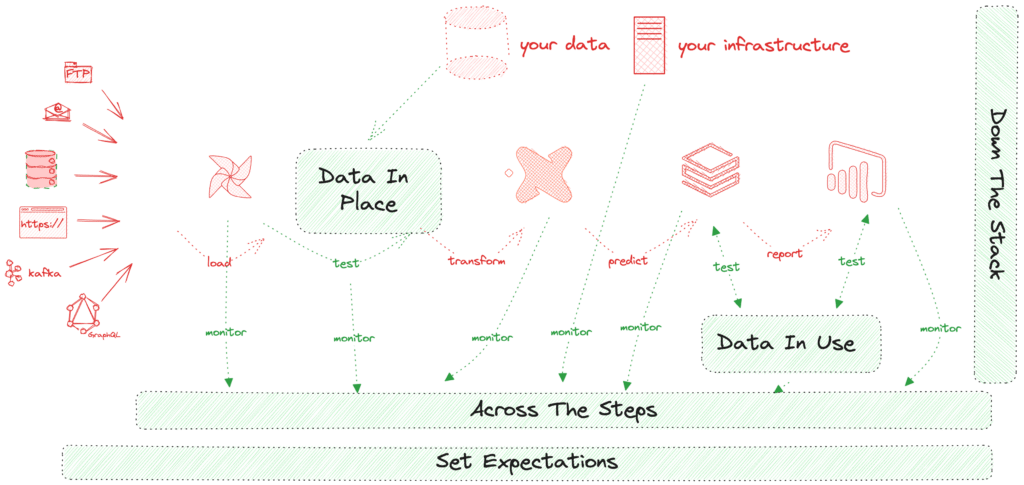 Five Pillars of Data Journeys in Operational Context.
Pillar 1. Across The Steps
“All happy, error-free Data Journeys are alike; each unhappy Data Journey is broken in its unique way.
– Anna Karenina Author Leo Tolstoy (sort of).
Things will break along your Data Journey. The question is, where did it happen? In our experience, the locus of those problems changes over time. Initially, the infrastructure is unstable, but then we look at our source data and find many problems. Our customers start looking at the data in dashboards and models and then find many issues. Putting the data together with other data sets is another source of errors. After data systems start to get used, changes will introduce more problems.
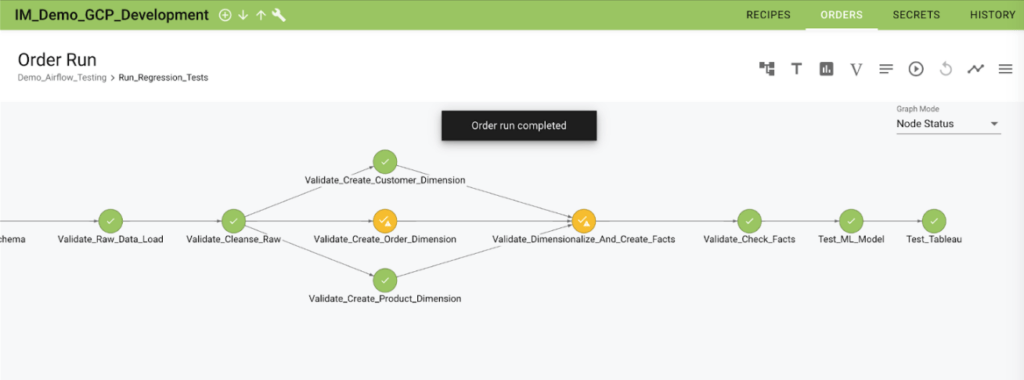
The critical question is where the problem is. This pillar emphasizes the need to continually monitor the execution of each process within every step data takes on its journey to your customer to ensure that the order of operations is correct, tasks execute according to schedule, and the data itself is correct. The Data Journey, in this sense, provides transparency about the status and outcomes of individual tasks, offers insights into potential bottlenecks or inefficiencies in the sequence of operations, and helps ensure that scheduled tasks are executed as planned. Consider a data pipeline orchestrated by Airflow.
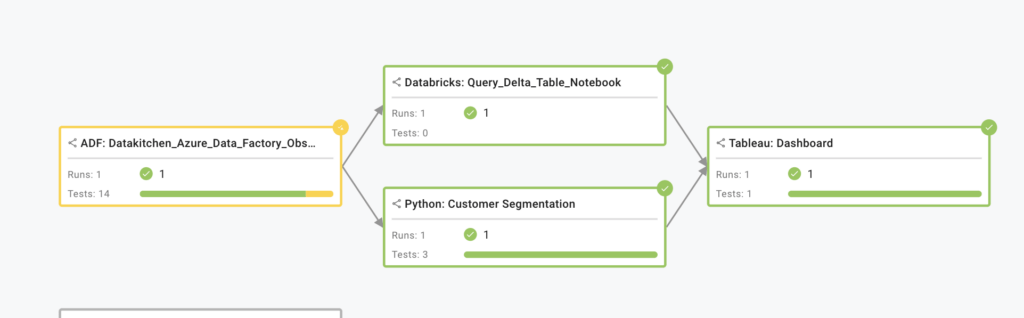
The example above shows a Data Journey across multiple tools.
Observability in this context involves monitoring the orchestrator’s schedule and identifying potential issues like overlapping jobs that could cause bottlenecks or delays due to resource contention. Did the Airflow job complete before the dashboard was loaded? Was it on time? The value here is increased process reliability. With such observability, you can quickly pinpoint process issues, minimize downtime, notify downstream, and ensure a smoother, more reliable end-to-end Data Journey.
Pillar 2. Down The Stack
“Shrek: Data Journeys are like onions.
Donkey: They stink?
Shrek: No. Layers. Onions have layers. Data Journeys have layers. Do you get it?
Donkey: Oh, they have layers. Oh. You know, not everybody like onions.”
– Shrek Movie (?)
Monitoring is another pillar of Data Journeys, extending down the stack. It involves tracking key metrics such as system health indicators, performance measures, and error rates and closely scrutinizing system logs to identify anomalies or errors. Moreover, cost monitoring ensures that your data operations stay within budget and that resources are used efficiently. These elements contribute to a fuller understanding of the operational landscape, enabling proactive management and issue mitigation. Going down the stack could involve checking error messages to identify faulty processes, monitoring server CPU usage to spot potential performance issues, assessing disk sizes to ensure sufficient storage capacity, and tracking run costs to ensure your operations stay within budget.
Data Journeys run on software, on servers, and with code. They can break.
The major value here is a clear and comprehensive understanding of your technology’s status. You can proactively spot and address issues before they escalate and ensure your technology stack runs smoothly and cost-effectively.
Pillar 3. Data In Place
“Data don’t tell me you’re sorry ’cause you’re not / Bad data I know you’re only sorry you got caught.”
– Take A Bow, Rihanna (I may have heard it wrong)
Validating data quality at rest is critical to the overall success of any Data Journey. Using automated data validation tests, you can ensure that the data stored within your systems is accurate, complete, consistent, and relevant to the problem at hand. This pillar emphasizes the importance of implementing thorough data validation tests to mitigate the risks of erroneous analysis or decision-making based on faulty data.
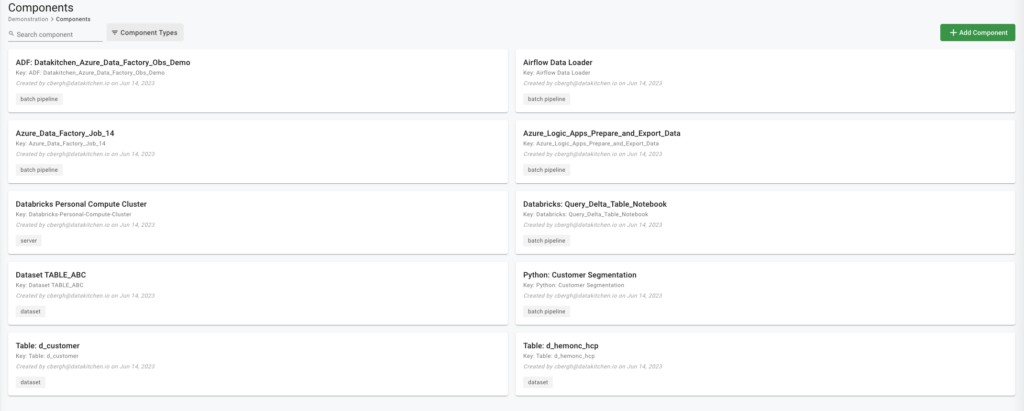
Checking data in place involves looking at syntactic attributes such as freshness, distribution, volume, schema, and lineage. Start checking data in place with a strong data profile. Then, the ingestion-focused data tests can look for validations by checking incoming data schema, assessing data row counts, loading data, evaluating data volume, or specific column values for anomalies.
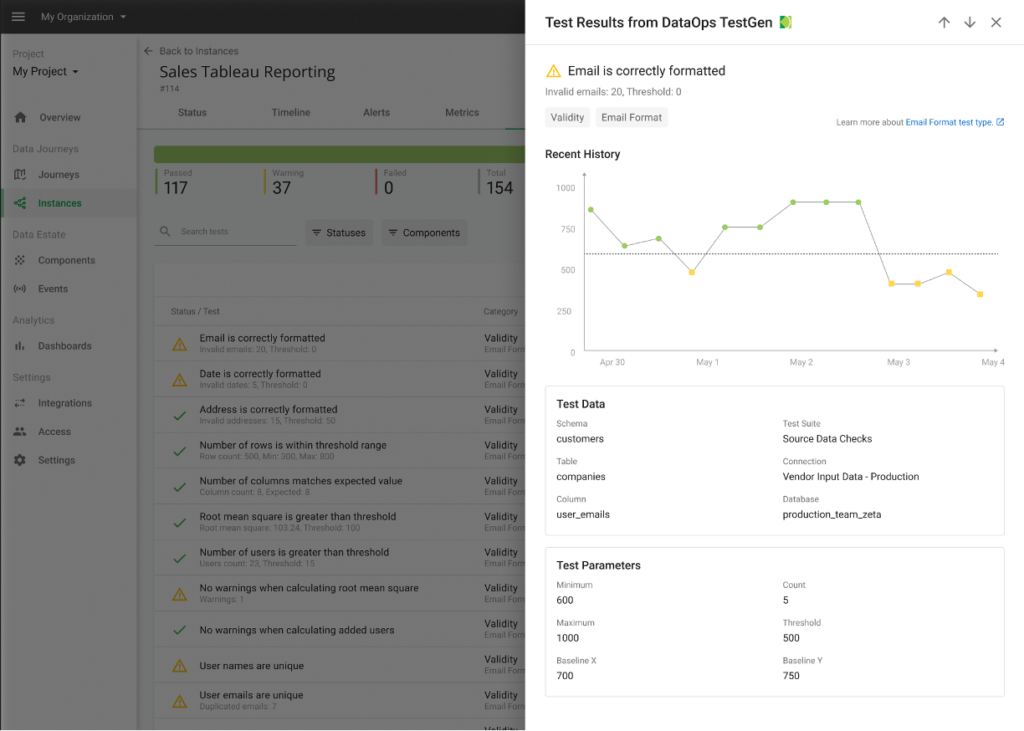
The image above shows an example ”data in place’ test result.
Checking data in place also involves looking beyond data syntax. Teams need data validation tests that are based on domain-specific or business rules that are meaningful to their organizations. These tests can rely upon historical values to determine whether data values are reasonable (or within the reasonable range). For example, a test can check the top fifty customers or suppliers. Did their values unexpectedly or unreasonably go up or down relative to historical values? What is the acceptable range? 10% 50%? Data engineers are unable to make these business judgments. They must rely on data stewarts or their business customers to ‘fill in the blank’ on various data testing rules.
The central value here is ensuring trust through data quality validation tests. By conducting these checks, you can catch data issues early, ensuring that your downstream analyses and decisions are based on high-quality data.
Pillar 4. Data In Use
“Truth about your data tools hurts. Maybe not as much as jumping on a bicycle with a seat missing, but it hurts.” —Lt. Frank Drebin/Leslie Nielsen (maybe)
Monitoring and testing the data to ensure its reliability continually is crucial. This action involves testing the results of data models for accuracy and relevance, evaluating the effectiveness of data visualizations, ensuring that data delivery mechanisms are operating optimally, and checking the data utilization to ensure it meets its intended purpose. This pillar underscores the need for robust testing and evaluation processes throughout the ‘last mile’ of the Data Journey.
The above image shows an example custom ‘data in use’ test of a predictive model and API.
The value here is improved end-user experience. Conducting these tests ensures that your data products (like predictive models or visualizations) are accurate, relevant, and valuable to your end users. After all the hard work and multiple systems data took to get to your customer, isn’t value the key to judging success?
Pillar 5. Set Expectations
“High Data Journey expectations are the key to everything.”
– Sam Walton (slightly modified)
The final pillar of Data Journeys involves setting and managing expectations. A Data Journey is a collection of expectations of how your data world should be. Of course, the world never meets our expectations.
A Data Journey allows you to compare anticipated outcomes against reality, set up alert mechanisms to notify stakeholders when discrepancies arise, and analyze results to understand what led to the outcome. It emphasizes the need for a systematic approach to understanding and managing deviations from expected outcomes. Data problems often come with a ‘blast radius.’ For example, what reports, models, and exports are affected if an ingested file is too small? Data Journeys are the ‘process lineage’ that can help you find the full extent and impact of a problem and notify those who may be impacted.
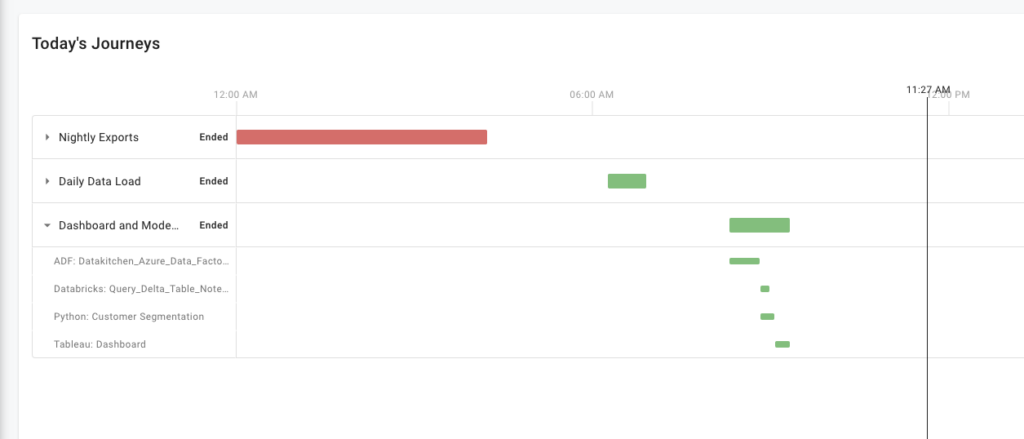
A dashboard allows you to share the progress of the latest instance of your Data Journeys.
Trust building between the data team and their customer is vital. The more your data team knows about problems before they occur, the more trust your customers will have in your team. Data Journeys with incident alerting provided the bridge to build that trust.
Conclusion
The “Five Pillars of Data Journeys” outline a comprehensive approach to tracking and monitoring data across its lifecycle. Firstly, it highlights the importance of understanding the sequence and results of data operations, including regular checks, maintaining the correct order of operations, and adhering to schedules. Secondly, it underscores the necessity to monitor metrics, logs, and associated costs down the stack, ensuring the efficiency and cost-effectiveness of data operations. Thirdly, it suggests automatic data quality validation in place through business domain tests, enhancing data integrity and reliability. Fourthly, the pillars advocate for testing the results of models, visualizations, and data utilization to validate data in use, assuring the effectiveness of data applications. Lastly, it encourages setting and comparing expectations against reality, alert systems, and in-depth analysis to maintain a robust and accurate data environment.
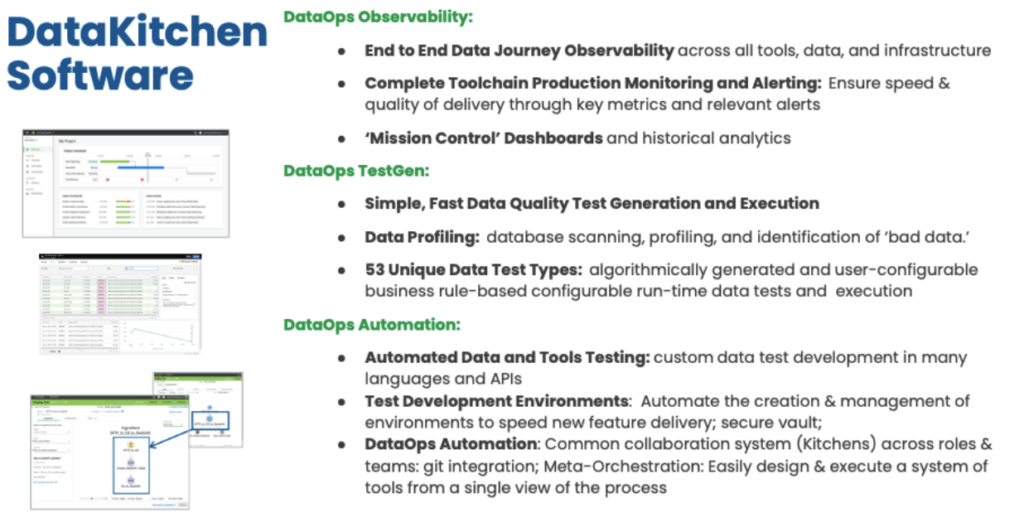
DataKitchen Data Journey Products
DataKitchen’s products implement the five pillars of Data Journeys. DataKitchen’s products track and monitor all levels of the data stack, from data to tools to servers to code to tests across all critical dimensions. They supply real-time statuses and alerts on start times, processing durations, test results, and infrastructure events, among other metrics. With this information, you can know if everything ran on time and without errors and immediately detect the parts that didn’t.
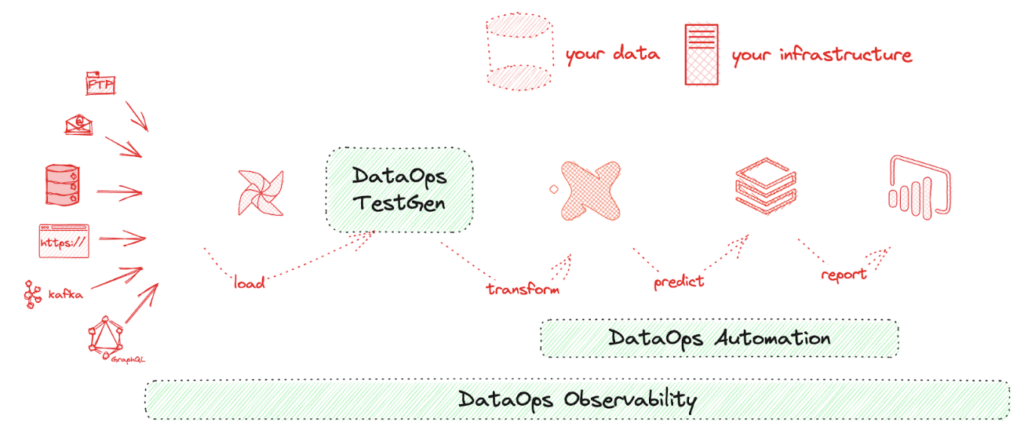
DataKitchen’s Products Implement The Five Pillars Of Data Journeys
DataOps Observability provides the Data Journey abstraction, expectations, alerts, and analysis. DataOps TestGen provides in-database data testing results shared with DataOps Observability. Finally, DataOps Automation provides tool, model, and API-level testing shared with DataOps Observability.
For More Information On Data Journeys And DataKitchen’s Products