article thumbnail

Top 20 Visualization Dashboards for Mapping COVID-19

Analytics Vidhya

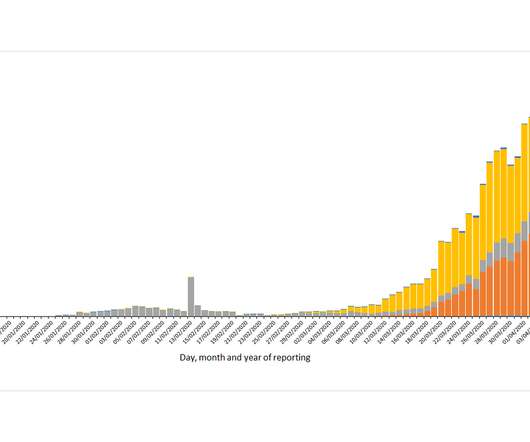
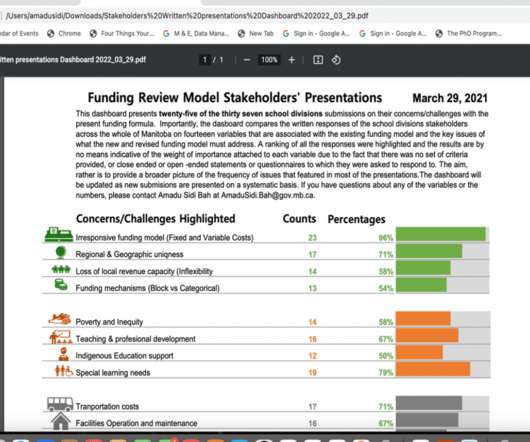
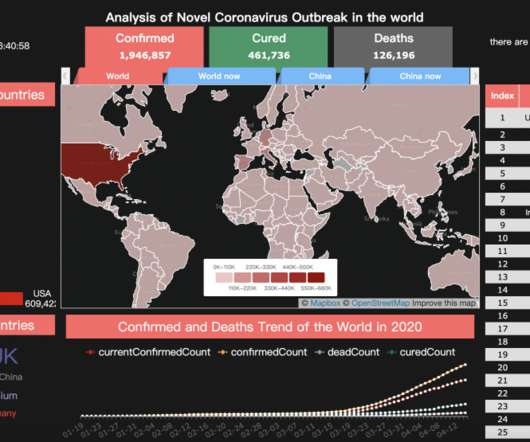
Introduction The best way to track the COVID-19 outbreak is by using data and visualization. The post Top 20 Visualization Dashboards for Mapping COVID-19 appeared first on Analytics Vidhya. The COVID-19 patterns are sometimes contradictory and this is.

article thumbnail

Open-Source BI Tool Metabase for Data Visualization and Analytics

Analytics Vidhya

Try Metabase, an open-source Business Intelligence (BI) tool for creating interactive dashboards from large datasets. Learning […] The post Open-Source BI Tool Metabase for Data Visualization and Analytics appeared first on Analytics Vidhya. Discover the power of Metabase in this guide tailored for data professionals.

Insiders

Sign Up for our Newsletter

This site is protected by reCAPTCHA and the Google Privacy Policy and Terms of Service apply.

Trending Sources

article thumbnail

Create Stock Exchange Dashboard using Dash in Python!

Analytics Vidhya

This article was published as a part of the Data Science Blogathon Introduction Dash is an open-source web framework for creating analytical dashboards and data visualizations. It helps data analysts to deploy dashboards and serve these dashboards to the main web application. Dash constitutes of three technologies: 1.

article thumbnail

10 Data Visualization Books

Analytics Vidhya

Introduction to Data Visualization The amount of data has changed in the digital age, becoming both a challenge and an opportunity. Data visualization has become an efficient method for communicating insights and making sense of complex information.

article thumbnail

The Definitive Guide to Dashboard Design

Dashboard design can mean the difference between users excitedly embracing your product or ignoring it altogether. Great dashboards lead to richer user experiences and significant return on investment (ROI), while poorly designed dashboards distract users, suppress adoption, and can even tarnish your project or brand.

article thumbnail

Building an Interactive Dashboard using Bokeh and Pandas

Analytics Vidhya

This article was published as a part of the Data Science Blogathon image source: Author The Importance of Data Visualization A huge amount of data is being generated every instant due to business activities in globalization. The post Building an Interactive Dashboard using Bokeh and Pandas appeared first on Analytics Vidhya.

article thumbnail

Create Interactive Dashboards with Streamlit and Python

Analytics Vidhya

Introduction In Data Visualization, Dashboard is the great Graphical User Interfaces that. The post Create Interactive Dashboards with Streamlit and Python appeared first on Analytics Vidhya. This article was published as a part of the Data Science Blogathon.

article thumbnail

Monetizing Analytics Features: Why Data Visualization Will Never Be Enough

Think your customers will pay more for data visualizations in your application? But today, dashboards and visualizations have become commonplace. Which analytics features are replacing visualizations as “the next big thing”. Five years ago they may have. You’ll learn: The 3 benefits of deeply embedding BI.

article thumbnail

Monetizing Analytics Features

Think your customers will pay more for data visualizations in your application? But today, dashboards and visualizations have become table stakes. Five years ago, they may have. Turning analytics into a source of revenue means integrating advanced features in unique, hard-to-steal ways.

article thumbnail

6 Styles of Data Analysis and Visualizations

Get inspiration for your next dashboard update in this guide to the six styles of analytics and data visualizations.

article thumbnail

Monetizing Analytics Features: Why Data Visualizations Will Never Be Enough

Think your customers will pay more for data visualizations in your application? But today, dashboards and visualizations have become table stakes. Five years ago they may have. Discover which features will differentiate your application and maximize the ROI of your embedded analytics. Brought to you by Logi Analytics.