Data Visualization: Theory and Techniques
Unlocking the secrets of how to observe our data-driven world.
Image by freepik
In a digital landscape dominated by big data and intricate algorithms, one would think that the average person is lost in an ocean of numbers and data.
Isn’t it?
Yet, the bridge between raw data and comprehensible insights lies in the art of Data Visualization.
It’s the compass that directs us, the map that guides us, and the interpreter that decodes the mass amount of data that we encounter daily.
But what’s the magic behind a good visualization?
Why does one visualization enlighten while another confuses?
Today, we are going back to the basics and trying to understand the fundamentals of Data Visualization.
Let’s discover it all together! 👇🏻
Breaking Data Visualization to Its Basics
Mastering how to tell a story efficiently is one of the hardest skills to master as a data scientist. If we check the term Data Visualization in a dictionary, we find the following definition:
“The act of representing information as a picture, diagram or chart, or a picture that represents information in this way”
This basically means that Data Visualization aims to craft a story from the dataset, presenting insights in a form that’s digestible, appealing, and impactful.
Data visualization, or making data look good in charts and graphs, might not seem as cool as stuff like machine learning.
But, it's really a key part of what a Data Scientist does.
In today’s data-driven world, Data Visualization is like the glasses that help us see clearly. And, for those not well-versed in the language of numbers and algorithms, it offers an efficient means to understand complex data narratives.
Any chart is always composed of two main components:
1. Data Types
I bet you are thinking of data as numbers, but numerical values are only two out of several types of data we may encounter. Whenever we visualize data, we always need to consider what types of data we are dealing with.
In addition to continuous and discrete numerical values, data can come in the form of discrete categories, in the form of dates or times, and as text.
When data is numerical we also call it quantitative and when it is categorical we call it qualitative.
So any displayed data can always be described in one of the following categories.
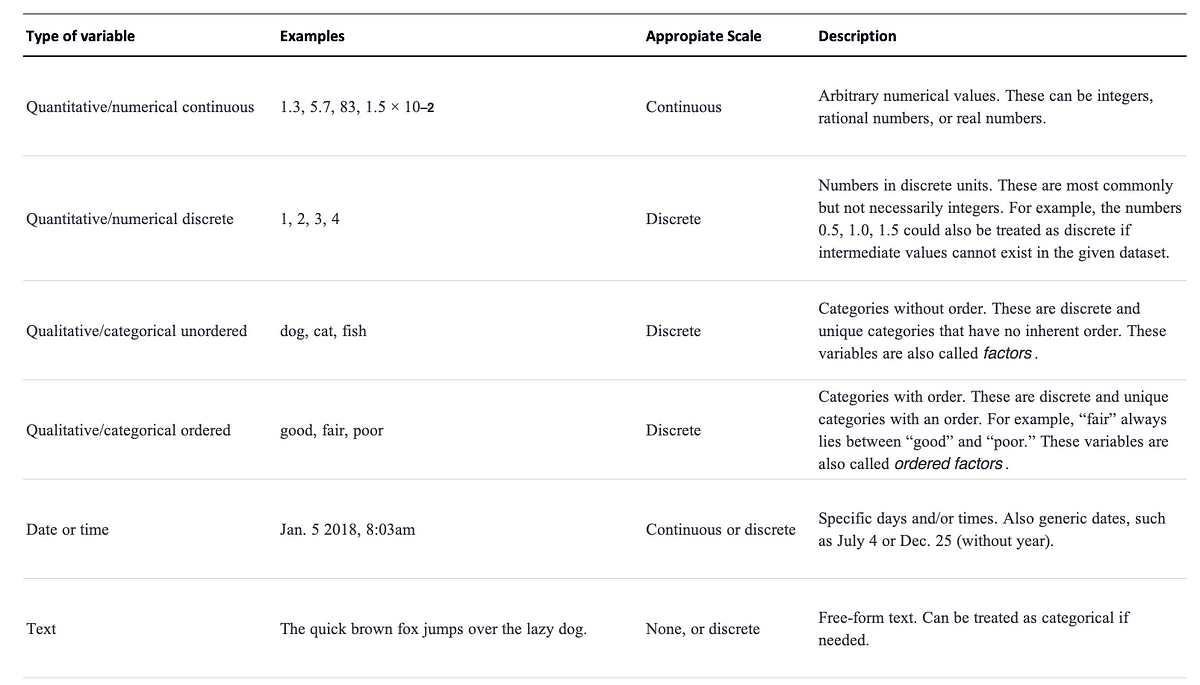
Image by Author. Classification extracted from Fundamentals of Data Visualization, O’Reilly.
Once we have a clear what kind of data we have, we need to understand how to encode this data into final charts.
2. Encoding Information: The Visual Lexicon
Visual encoding is at the core of data visualization. It translates abstract numbers into graphical representations, a language we’re all fluent in.
Even though there are many different types of data visualizations, and at first glance, a scatterplot, a pie chart, and a heatmap don’t seem to have much in common, all these visualizations can be described with a common language that captures how data values are turned into blobs of ink on paper or colored pixels on a screen.
But… as you already must be aware of…
There are thousands of ways to encode numbers!
There are two main groups:
- Retinal Encodings: From shape, size, colors, and intensity, these are elements our eyes catch instantly. They are inherent to the element.
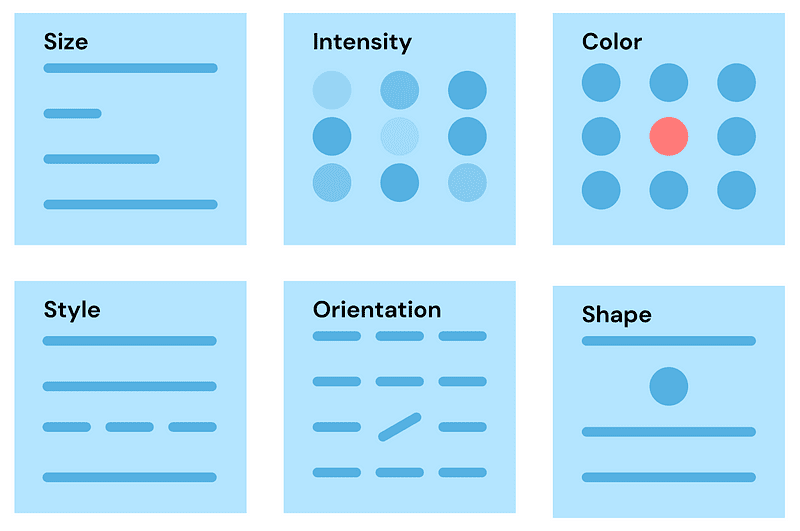
Image by Author
- Spatial Encodings: They exploit our brain’s cortex’s spatial awareness to encode information. This kind of encoding can be achieved through position in a scale, a defined order or using relative sizes.
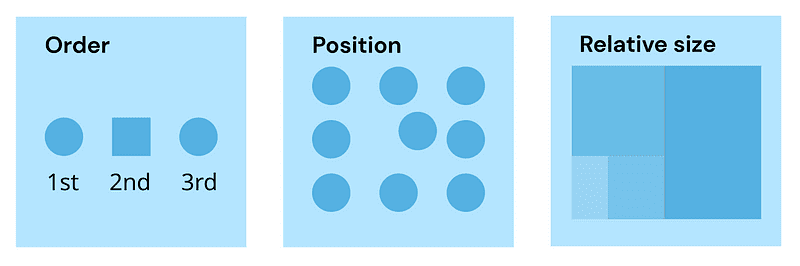
Image by Author
With all the previously explained encodings, we could use all of them in one chart but it would be hard for the reader to grasp all the information quickly. Overloading a chart with multiple encodings can be confusing so 1 or 2 retinal encodings per chart is optimal.
Always remember that less is often more, so always try to create minimalist and easy-to-understand charts.
Think of it as seasoning a dish-a sprinkle of salt and pepper might enhance it, but pouring the entire salt shaker might ruin the taste.
So now… which encoding should one choose?
That, my friends, depends on the story you want to weave.
So you could better ask…
What Works and What Doesn’t?
While the visual arsenal at our disposal is vast, not all weapons are fit for every battle.
Think about what encodings are best for what kind of variable.
- Continuous data variables, like weight and height, find their best representation in position on a common scale.
- Discrete ones, such as gender or nationality, shine when depicted by colors or spatial regions.
There are some reasons behind the intuitiveness of some charts. And there are two main theories behind them.
1. Gestalt Theory
People who work with technology sometimes forget about the human side of things. The Gestalt Principles are rules from psychology that explain how our brain sees patterns.
Some of these rules help us understand why we group things that look alike or notice things that stand out.
- Similarity: Gestalt similarity means our brain groups things that look alike. This can be because of their position, shape, color, or size. This is extensively used in heat maps or scatter plots.
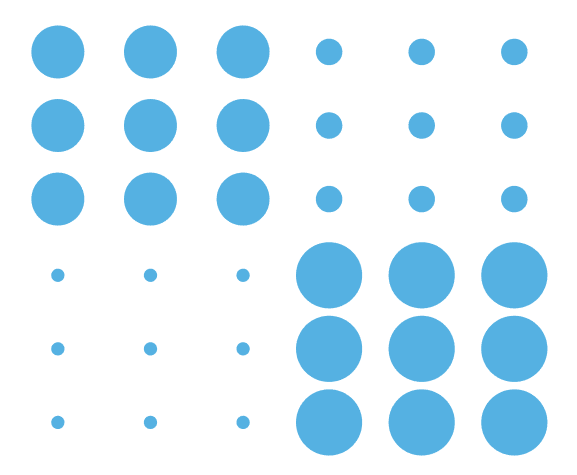
Image by Author
- Closure: Objects inside a border-like a line or a shared color-look like they belong together. This makes them stand out from other things we see. We often use borders or colors in tables and graphs to group data.
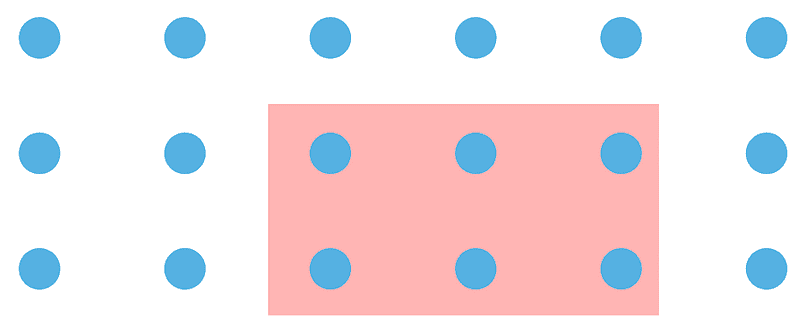
Image by Author
- Continuity: When individual elements are connected, our eyes think they belong together. Even if they look different, the line makes us see them as a group. This is extensively used in line charts.
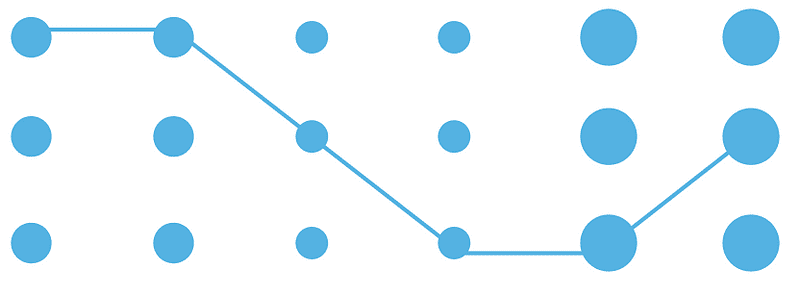
Image by Author
- Proximity: We think things are in the same group if they are close to each other. To show things belong together, put them close. Using a little space can help separate different groups. This is commonly used in scattering plots or node-link diagrams.
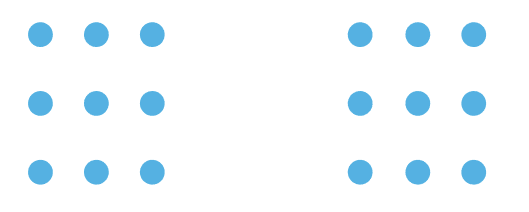
Image by Author
So the Gestalt principles and their interactions are important to consider when making visualizations.
2. The Principle of Proportional Ink
In many different visualization scenarios, we represent data values by the extent of a graphical element.
It is common practice to use the word ink to refer to any part of a visualization that deviates from the background color. This includes lines, bars, points, shared areas, and text.
For example, in a bar plot, we draw bars that begin at 0 and end at the data value they represent. In this case, the data value is not only encoded in the endpoint of the bar but also in the height or length of the bar.
If we drew a bar that started at a different value than 0, then the length of the bar and the bar endpoint would convey contradicting information.
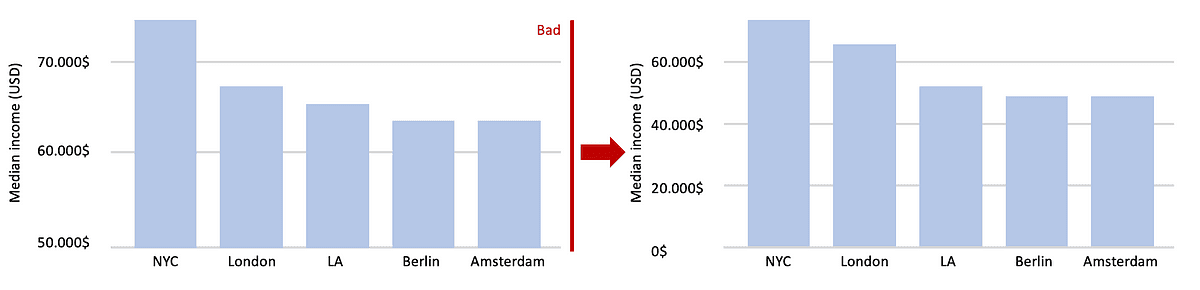
Image by Author
In all these cases, we need to make sure that there is no inconsistency. This concept has been termed the principle of proportional ink by Bergstrom and West.
“When a shaded region is used to represent a numerical value, the area of that shaded region should be directly proportional to the corresponding value.”
Violations of this principle are quite common when trying to manipulate data, in particular in the popular press and in the world of finance.
Similar issues will happen whenever we use graphical elements such as rectangles, shaded areas of arbitrary shape, or any other elements that have a defined visual extent that can be either consistent or inconsistent with the data value shown.
The Essence of a Good Visualization
A striking balance between aesthetics and functionality is pivotal. Adhering strictly to principles like Bergstrom’s proportional ink, but not at the cost of readability.
And while some encodings may seem less effective, they can be chosen deliberately to make a statement or evoke an emotion.
In our age of an ever-increasing flow of data, the importance of crafting meaningful visual narratives cannot be overstated. Especially when trying to communicate our insights to non-data professionals.
Good data visualization isn’t just about presenting numbers, but instead trying to articulate our data around a story. Bringing our data to life while telling stories, and forging connections between raw information and real-world implications and insights.
As technologists and data lovers, it’s our art, our language, and our bridge to the whole world.
Josep Ferrer is an analytics engineer from Barcelona. He graduated in physics engineering and is currently working in the Data Science field applied to human mobility. He is a part-time content creator focused on data science and technology. You can contact him on LinkedIn, Twitter or Medium.