


By now, you probably already know the drill. To kick off every year, we host a technical webinar with members of our AI Labs research team in order to hone in on some of the hot ML trends we’ll likely see more of in the coming year. To take that to a new level, this year’s webinar combined the research insights with practical data science projects that back up the trends. To make the webinar content more digestible after the fact, we’ve broken up the transcription into a blog series so it’s more accessible as you drill into specific topics. We have already tackled model changes, data, drift, and anomaly detection as well as learning with small data, so up next is a summary of retail markdown optimization and uplift modeling. Enjoy!
Reda Affane:
What I want to do now is, given that you have a solution to every one of my questions, I'm going to just take this opportunity to ask you another question which is related to a completely different subject which I chose because I know you really fond of, and it touches on a theoretical backbone, which you're really fond of, which is I can spoil it now, which is called causal inference.
I know we did this project recently with an online retailer and the goal was to optimize online revenue in a specific way, which I'm going to show you in a minute. Along the way, we were feeling that this is a subject which touches a lot on causal inference. We're trying to assess the effect of a cause on a specific outcome. I was wondering how that theoretical backbone can complement what we've been doing so far.
Like I said, this was an online retailer. The overall context was that this retailer is used to applying discounts on products. The question or the use case that I'm presenting to you now is what specific level of discounts should I apply to every product in my product catalog so as to maximize a margin, so as to maximize my revenue? Actually, the project is bigger than this because you have two questions. The first question is which products do I need to discount? And then based on those products, what's the level of discount that I should apply?
Discounts Drive Sales (When Applied Wisely)
In this presentation, I'm only going to focus on the second point, which is what's the level of discount I need to apply on my products? As you can see, this is a very important question, because if you imagine there's a theoretical optimal discount, if you discount your product lower than that optimal discount threshold, then your product will not be discounted very much. Which means it's going to be expensive, which means customers will not buy it. This is what we call a sell opportunity loss.
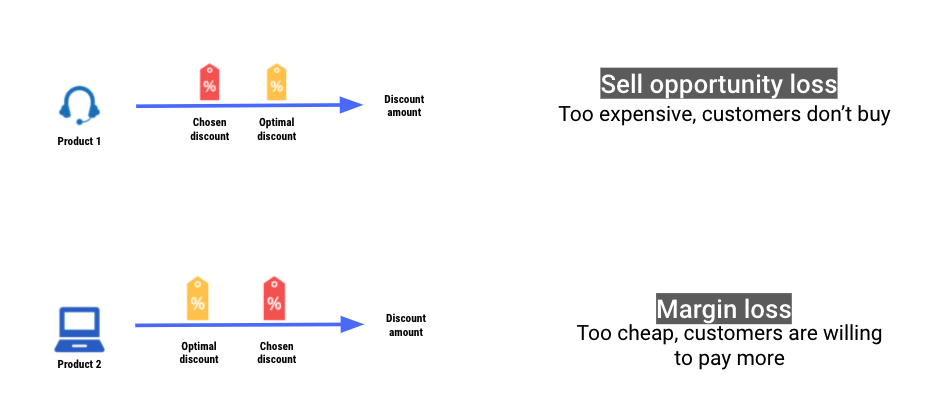
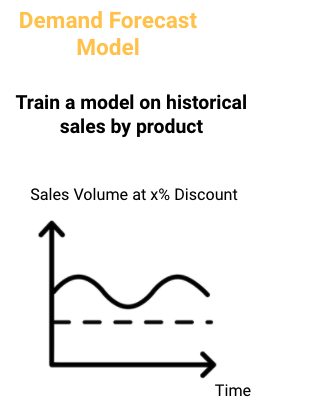
On the other hand, if you randomly choose a discount and it happens to be higher than the optimal discount, well, then you are losing on some margin, on some money because customers are willing to pay more and you're selling your product for way less than that. There's an optimal point to find, and this is what we're trying to do in this project. At the end of the day, what we were aiming at is to have, as you can see for each product, a graph, which looks like the graph below. You can see that for each discount level, we have a prediction of what we would expect as gains in regards to the volume that we can sell that product. If the curve follows, a little bit, our intuition in the sense that if I apply a 5% discount, then I'm going to sell a specific volume of items. But if I apply a higher discount, for example, a 30% discount, then I'm going to sell more.

And the idea is, taking into account this information and including other information like the cost of manufacturing one product or the cost of storing that product, or every the cost related to the product, also, the price of the product, I can figure out what's the best discount that I need to apply to my product.
So, at the end of the day, what I need is to be able to get this graph that we see above And in order to get to that graph, what we've done is that we've simply trained a forecast model on every product. Here, we're talking at the product level. For each product, we have a model forecasting the amount of sales that I could expect in the future. Let's suppose it's a weekly forecast, so that I can expect it next week.
And the crucial thing is that in that model, we also take into account as a feature, the discount. This is possible because we have this information because all of the models for which we want to do this analysis, all of these models have a history of sales. And all of these models have been discounted in the past at different levels of discount. So we have this information and we use it as a feature for the forecasting model. Sometimes we're going to see more discounts and we're going to see less discounts. So there is some kind of uncertainty measurement going on there.
Also, Léo, I know that this is a subject that you like, but maybe it's not a subject for today. But anyhow, it was a real concern. But at the end of the day, once we have this model, what we do is that we just take this model and apply to different levels of discounts.

Just to be complete, we didn't use only the discount as an input of this forecasting model. Remember, we're trying to forecast the amount of sales that we can have in the next week. In order to do that, we can use multiple pieces of information and this is an example of features and variables that we've used in that model. The best ones are how that model performed in the past. For example, in the last couple of weeks or in the same week, last year. It gives you an idea of how this product is appreciated by the clients and an idea about the seasonality.
Then we use some specific features for each product. So each product has a brand, a product category, and a lot of other features specific to each product, which I'm not going to spend a lot of time on. Then we have, of course, some features related to the time period. Are we in a holiday season? Is it the weekend? Is it a Black Friday period? What's the economic climate? Also, we have some information and some signals around the depreciation of these products. Then of course, like I said, the price and the discounts are also features of that model, very strong features. And also we've included some sort of competition analysis to this forecasting model.
All this information, again, with the discount level, gave us that end goal, which is, remember, at each discount level, this is the expected amount of items that we would sell for that product. The end game was to be able to choose which discount is better. Better in a sense that it maximizes some KPIs, so we had pretty much two types of KPIs. The first type is a financial KPI (i.e., How many more dollars will I gain?) And then other KPIs, which included, for example, depreciation of the product because you wouldn't sell as much of the product as the second year and the third year as the first year. There's some sort of analysis going on there. And also some KPIs' more related to the business of selling those specific products.
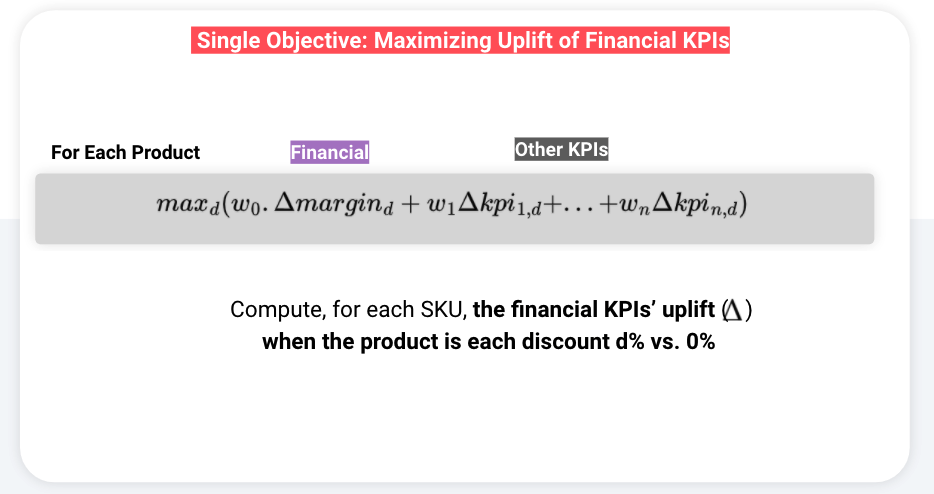
The way to read this equation is very simple. For each product, we would consider each discount. We would compute what the margin is, the financial outcome, the financial revenue that we will have with this discount and without this discount. We can compute this information because we know for this specific discount, how many items we can sell. We also know how much we're going to sell the unit. And we also know how much it costs to manufacture it.
We know all the information and all the relevant variables to compute this. We do this through every discount level and, at the end of the day, we just choose the discount level which maximizes this equation. As you can see, there's some sort of, you've talked about uplift earlier. I can see the relation to this equation. I can also see that, like I said, there's some causal inference going on because the discount is the cause and we're trying to assess the effects of that cause. What I want to know, Léo, is what you think about this approach and how we would compliment it or maybe just back test it to be sure that everything is okay.
Léo Dreyfus-Schmidt:
Yeah. Well, great. First of all, once again, and I'm not just saying this is a great project. I think it's a dream project for everybody, every marketer out there. Everyone wants to know, "How can you sell better?" Not just how can you sell more, but how can you sell better? But actually, before I answer your question, I have a question for you. I'm very curious about that project. Did you have to worry about what we call cannibalization, which is the interaction between products? If you were discounting more than one product, then maybe you can have an impact within a similar product category. It could be competition or is it something that is left for a different stage?
Reda Affane:
Yeah, that's a very good question. It was a concern. It was a major concern, so let me just go back. It was a major concern indeed. We took the simple approach to say that we're not going to include this in the model because it would complicate it a lot. This was a decision of the, at the end of the day, of the business side. We knew which product we needed to discount, we wanted to discount. This is the first step that I mentioned earlier. We know that we have the right to discount these products and if discounting these products would not affect in a bad way or in a relevant way other products, and this was information which we had directly from the teams.
Stay tuned for our next article which will deep dive into the final ML trend we outlined for 2022: causal inference for machine learning.