The Data Quality Hierarchy of Needs
Just as Maslow identified a hierarchy of needs for people, data teams have a hierarchy of needs, beginning with data freshness; including volumes, schemas, and values; and culminating with lineage.
Maslow identified a hierarchy of needs for human beings, beginning with a broad base of physiological needs such as food and shelter, rising through social needs, and capping off with creativity and self-realization.
Data teams have their own hierarchy of needs focused on making sure the data is right. Having worked with data engineers and data scientists in companies large and small, here’s how I would describe a data team’s hierarchy of needs for data quality, starting at the ground floor with data freshness, where we determine whether or not we have the data we need in the first place.
Ideally, a team should have tools in place to measure data quality at each of these levels.
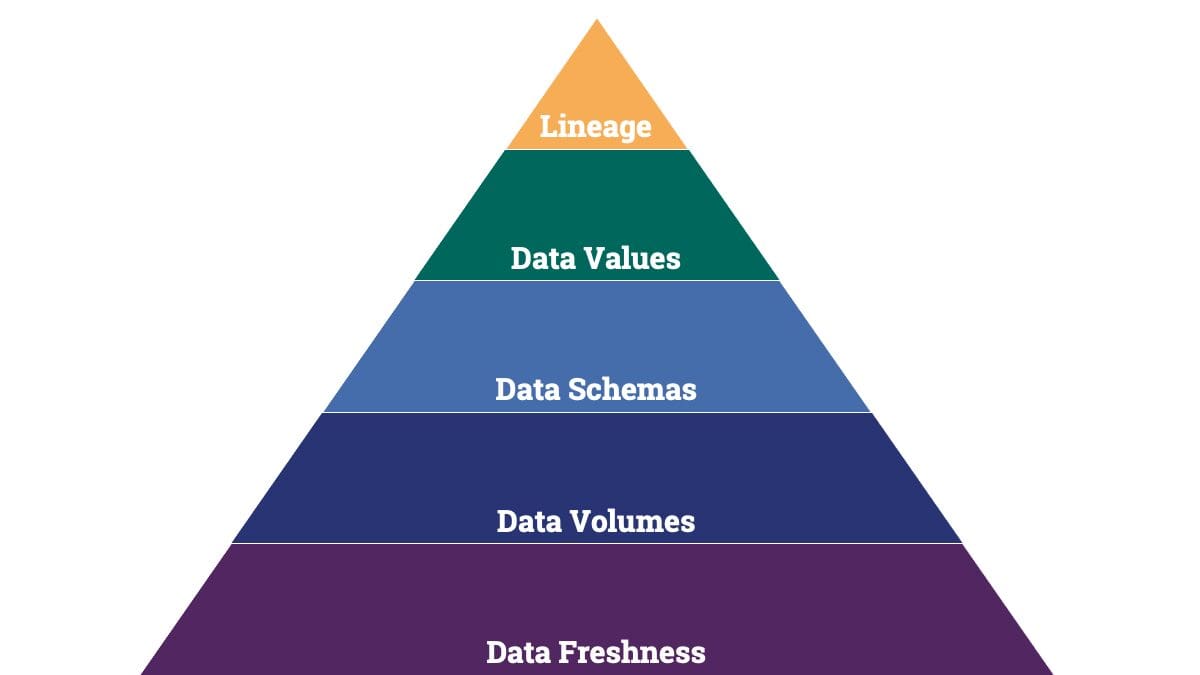
A data team’s hierarchy of needs.
Layer 1: Data Freshness
To have good quality data, you have to make sure you have data in the first place.
Did your pipeline run? If so, when? Did the pipeline produce new data, or did it produce the same data as a previous run? To check for stale data, one must proceed carefully and extensively to identify stuck data feeds. It’s easy to detect that nothing has updated, but in many cases, a sequence number or timestamp movement doesn’t mean that the rest of the data has moved.
Layer 2: Data Volumes
Once data freshness is established, the next need to address concerns data volumes. We might ask questions such as:
- Are the data volumes in line with what we expected?
- If data volumes vary, are they in line with trends we’ve already observed in our business, such as little activity on weekends or in the middle of the night?
In some businesses, such as retailers, holidays and run up to holidays may have different volumes. Depending on the application, analyzing data volumes might require robust data models that consider multiple features.
Layer 3: Data Schemas
Next is the layout of the data: the field names and their types. In my work with data teams, I’ve seen a number of approaches for tracking this, from using JSON data stored in string fields to using sub-record data types in systems that support it, such as BigQuery. There are many considerations when deciding an approach, but the key areas of interest usually are focused on missing data columns or critical fields.
For typeness checking, my advice is to proceed with caution. Many strings in dev and production environments are actually dates or numbers. You might want to consider “promoting” types to what their best representation should be. This means that on a mixed type field, you’ll build a model for numeric values separate from strings, if applicable.
Layer 4: Data Values
Finally, we consider the content of the data values themselves. To assess data quality here, you’ll need to infer categories if the uniqueness of the values is fairly low relative to the size of the population.
For strings, we compute a number of potential models to delineate and capture new types of strings without being hung up on simple questions like whether the value is null, or the string length.
Layer 5: Lineage Tagging with Metadata
Debugging data flows often leads to questions such as, “Why does this field have this value?”
In past lives of building data pipelines, I’ve run into the question this over and over. My solution was to augment the data with fields explaining the reasoning, where I could embed a variety of meta data: a human-readable explanation, a script file name and line number, other variables, or whatever I would need to debug the issue later. “I’ve marked this as out of stock because two data sources said it is out of stock even though our third data source says we have 1,000” is a very useful thing to have when examining a single record.
Not everyone has the luxury of appending significant metadata, but if you can do it, you should. And if you’re considering tools that can automatically find issues with the data fields, note that these same tools can analyze your new metadata fields, too, just leading to metadata alerts that can alert you to new behavior behind the scenes, if desired.
Making the Most of Your Hierarchy of Data Quality Needs
Something to keep in mind here is that this hierarchy really is a hierarchy. Everything begins with data freshness. If the data you’re analyzing in all the upper levels of the hierarchy is stale, you’ll have a false sense of confidence about the quality of your data. You’ll think today’s data is great, when you’re really repeating your analysis of last Wednesday’s data.
Once you’ve ensured that data is fresh, you can make sure you’ve got all the data, that you understand its schemas, and so on.
I recommend that data teams make sure they have tooling in place for each of these layers and that they can track them separately. Then, when all the layers are reporting solid results, you’ll know that you’ve met all the needs in your hierarchy. For a busy data team, that’s a kind of transcendence of its own. Even Maslow would be pleased.
Mitch Haile is CTO at Data Culpa, Inc. He has worked in the data trenches on data pipelines for retail data, machine-generated data, computer vision, and analytics applications for over fifteen years. He also has experience building solutions for complex data center environments, and has helped develop products for companies such as Data Domain (sold to EMC), Pancetera (sold to Quantum), and Conjur (sold to CyberArk). Mitch is a named co-inventor on over 25 granted patents for data compression, data optimization, and data security inventions.