7 Essential Data Quality Checks with Pandas
Learn how to perform data quality checks using pandas. From detecting missing records to outliers, inconsistent data entry and more.

Image by Author
As a data professional, you’re probably familiar with the cost of poor data quality. For all data projects—big or small—you should perform essential data quality checks.
There are dedicated libraries and frameworks for data quality assessment. But if you are a beginner, you can run simple yet important data quality checks with pandas. And this tutorial will teach you how.
We’ll use the California Housing Dataset from scikit-learn for this tutorial.
An Overview of the California Housing Dataset
We’ll use the California housing dataset from Scikit-learn’s datasets module. The data set contains over 20,000 records of eight numeric features and a target median house value.
Let’s read the dataset into a pandas dataframe df:
from sklearn.datasets import fetch_california_housing
import pandas as pd

# Fetch the California housing dataset
data = fetch_california_housing()

# Convert the dataset to a Pandas DataFrame
df = pd.DataFrame(data.data, columns=data.feature_names)

# Add target column
df['MedHouseVal'] = data.target
For a detailed description of the dataset, run data.DESCR as shown:
print(data.DESCR)
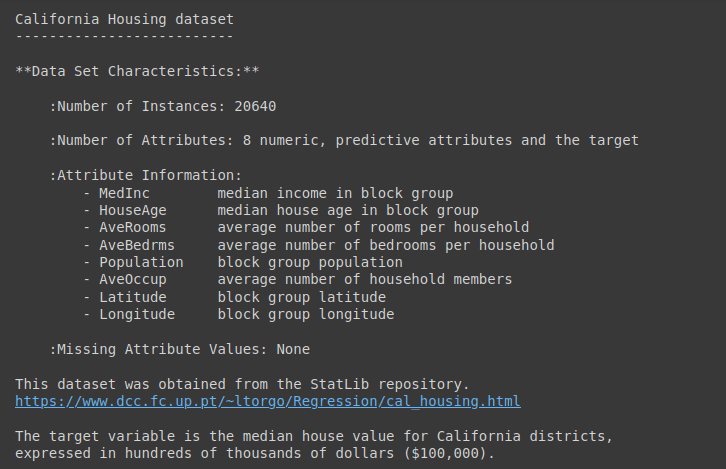
Output of data.DESCR
Let's get some basic information on the dataset:
df.info()
Here’s the output:
Output >>>


RangeIndex: 20640 entries, 0 to 20639
Data columns (total 9 columns):
 #   Column   	Non-Null Count  Dtype
---  ------   	--------------  -----
 0   MedInc   	20640 non-null  float64
 1   HouseAge 	20640 non-null  float64
 2   AveRooms 	20640 non-null  float64
 3   AveBedrms	20640 non-null  float64
 4   Population   20640 non-null  float64
 5   AveOccup 	20640 non-null  float64
 6   Latitude 	20640 non-null  float64
 7   Longitude	20640 non-null  float64
 8   MedHouseVal  20640 non-null  float64
dtypes: float64(9)
memory usage: 1.4 MB
Because we have numeric features, let us also get the summary starts using the describe() method:
df.describe()
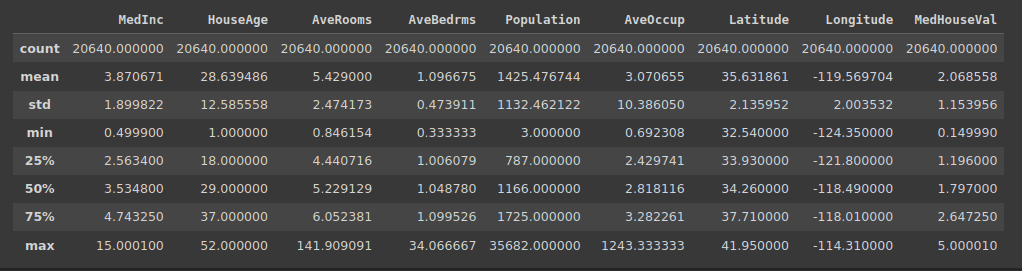
Output of df.describe()
1. Check for Missing Values
Real-world datasets often have missing values. To analyze the data and build models, you need to handle these missing values.
To ensure data quality, you should check if the fraction of missing values is within a specific tolerance limit. You can then impute the missing values using suitable imputation strategies.
The first step, therefore, is to check for missing values across all features in the dataset.
This code checks for missing values in each column of the dataframe df:
# Check for missing values in the DataFrame
missing_values = df.isnull().sum()
print("Missing Values:")
print(missing_values)
The result is a pandas series that shows the count of missing values for each column:
Output >>>

Missing Values:
MedInc     	0
HouseAge   	0
AveRooms   	0
AveBedrms  	0
Population 	0
AveOccup   	0
Latitude   	0
Longitude  	0
MedHouseVal	0
dtype: int64
As seen, there are no missing values in this dataset.
2. Identify Duplicate Records
Duplicate records in the dataset can skew analysis. So you should check for and drop the duplicate records as needed.
Here’s the code to identify and return duplicate rows in df. If there are any duplicate rows, they will be included in the result:
# Check for duplicate rows in the DataFrame
duplicate_rows = df[df.duplicated()]
print("Duplicate Rows:")
print(duplicate_rows)
The result is an empty dataframe. Meaning there are no duplicate records in the dataset:
Output >>>

Duplicate Rows:
Empty DataFrame
Columns: [MedInc, HouseAge, AveRooms, AveBedrms, Population, AveOccup, Latitude, Longitude, MedHouseVal]
Index: []
3. Check Data Types
When analyzing a dataset, you’ll often have to transform or scale one or more features. To avoid unexpected errors when performing such operations, it is important to check if the columns are all of the expected data type.
This code checks the data types of each column in the dataframe df:
# Check data types of each column in the DataFrame
data_types = df.dtypes
print("Data Types:")
print(data_types)
Here, all numeric features are of float data type as expected:
Output >>>

Data Types:
MedInc     	float64
HouseAge   	float64
AveRooms   	float64
AveBedrms  	float64
Population 	float64
AveOccup   	float64
Latitude   	float64
Longitude  	float64
MedHouseVal	float64
dtype: object
4. Check for Outliers
Outliers are data points that are significantly different from other points in the dataset. If you remember, we ran the describe() method on the dataframe.
Based on the quartile values and the maximum value, you could’ve identified that a subset of features contain outliers. Specifically, these features:
- MedInc
- AveRooms
- AveBedrms
- Population
One approach to handling outliers is to use the interquartile range, the difference between the 75th and 25th quartiles. If Q1 is the 25th quartile and Q3 is the 75th quartile, then the interquartile range is given by: Q3 - Q1.
We then use the quartiles and the IQR to define the interval [Q1 - 1.5 * IQR, Q3 + 1.5 * IQR]. And all points outside this range are outliers.
columns_to_check = ['MedInc', 'AveRooms', 'AveBedrms', 'Population']

# Function to find records with outliers
def find_outliers_pandas(data, column):
	Q1 = data[column].quantile(0.25)
	Q3 = data[column].quantile(0.75)
	IQR = Q3 - Q1
	lower_bound = Q1 - 1.5 * IQR
	upper_bound = Q3 + 1.5 * IQR
	outliers = data[(data[column] < lower_bound) | (data[column] > upper_bound)]
	return outliers

# Find records with outliers for each specified column
outliers_dict = {}

for column in columns_to-check:
	outliers_dict[column] = find_outliers_pandas(df, column)

# Print the records with outliers for each column
for column, outliers in outliers_dict.items():
	print(f"Outliers in '{column}':")
	print(outliers)
	print("\n")
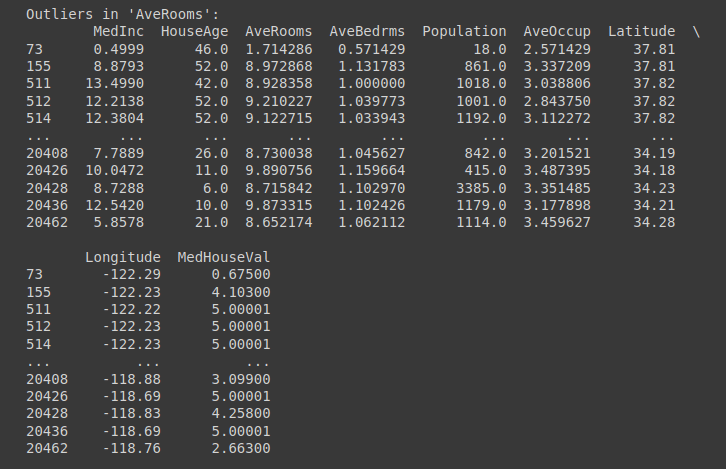
Outliers in 'AveRooms' Column | Truncated Output for Outliers Check
5. Validate Numeric Ranges
An important check for numeric features is to validate the range. This ensures that all observations of a feature take on values in an expected range.
This code validates that the 'MedInc' value falls within an expected range and identifies data points that do not meet this criteria:
# Check numerical value range for the 'MedInc' column
valid_range = (0, 16)
value_range_check = df[~df['MedInc'].between(*valid_range)]
print("Value Range Check (MedInc):")
print(value_range_check)
You can try for other numeric features of your choice. But we see that all values in the 'MedInc' column lie in the expected range:
Output >>>

Value Range Check (MedInc):
Empty DataFrame
Columns: [MedInc, HouseAge, AveRooms, AveBedrms, Population, AveOccup, Latitude, Longitude, MedHouseVal]
Index: []
6. Check Cross-Column Dependency
Most data sets contain related features. So it's important to include checks based on logically relevant relationships between columns (or features).
While features—individually—may take on values in the expected range, the relationship between them may be inconsistent.
Here is an example for our dataset. In a valid record, the ‘AveRooms’ should typically be greater than or equal to the ‘AveBedRms’.
# AveRooms should not be smaller than AveBedrooms
invalid_data = df[df['AveRooms'] < df['AveBedrms']]
print("Invalid Records (AveRooms < AveBedrms):")
print(invalid_data)
In the California housing dataset we’re working with, we see that there are no such invalid records:
Output >>>

Invalid Records (AveRooms < AveBedrms):
Empty DataFrame
Columns: [MedInc, HouseAge, AveRooms, AveBedrms, Population, AveOccup, Latitude, Longitude, MedHouseVal]
Index: []
7. Check for Inconsistent Data Entry
Inconsistent data entry is a common data quality issue in most datasets. Examples include:
- Inconsistent formatting in datetime columns
- Inconsistent logging of categorical variable values
- Recording of reading in different units
In our dataset, we’ve verified the data types of columns and have identified outliers. But you can also run checks for inconsistent data entry.
Let’s whip up a simple example to check if all the date entries have a consistent formatting.
Here we use regular expressions in conjunction with pandas apply() function to check if all date entries are in the YYYY-MM-DD format:
import pandas as pd
import re

data = {'Date': ['2023-10-29', '2023-11-15', '23-10-2023', '2023/10/29', '2023-10-30']}
df = pd.DataFrame(data)

# Define the expected date format
date_format_pattern = r'^\d{4}-\d{2}-\d{2}$'  # YYYY-MM-DD format

# Function to check if a date value matches the expected format
def check_date_format(date_str, date_format_pattern):
	return re.match(date_format_pattern, date_str) is not None

# Apply the format check to the 'Date' column
date_format_check = df['Date'].apply(lambda x: check_date_format(x, date_format_pattern))

# Identify and retrieve entries that do not follow the expected format
non_adherent_dates = df[~date_format_check]

if not non_adherent_dates.empty:
	print("Entries that do not follow the expected format:")
	print(non_adherent_dates)
else:
	print("All dates are in the expected format.")
This returns the entries that do not follow the expected format:
Output >>>

Entries that do not follow the expected format:
     	Date
2  23-10-2023
3  2023/10/29
Wrapping up
In this tutorial, we went over common data quality checks with pandas.
When you are working on smaller data analysis projects, these data quality checks with pandas are a good starting point. Depending on the problem and the dataset, you can include additional checks.
If you’re interested in learning data analysis, check out the guide 7 Steps to Mastering Data Wrangling with Pandas and Python.
Bala Priya C is a developer and technical writer from India. She likes working at the intersection of math, programming, data science, and content creation. Her areas of interest and expertise include DevOps, data science, and natural language processing. She enjoys reading, writing, coding, and coffee! Currently, she's working on learning and sharing her knowledge with the developer community by authoring tutorials, how-to guides, opinion pieces, and more. Bala also creates engaging resource overviews and coding tutorials.