


Better Forecasting with AI-Powered Time Series Modeling
AI-powered Time Series Forecasting may be the most powerful aspect of machine learning available today. Working from datasets you already have, a Time Series Forecasting model can help you better understand seasonality and cyclical behavior and make future-facing decisions, such as reducing inventory or staff planning. By simplifying Time Series Forecasting models and accelerating the AI lifecycle, DataRobot can centralize collaboration across the business—especially data science and IT teams—and maximize ROI.
AI Forecasting Can Overcome Real-World Complexity and Integrate Existing Processes
While AI-powered forecasting can help retailers implement sales and demand forecasting—this process is very complex, and even highly data-driven companies face key challenges:
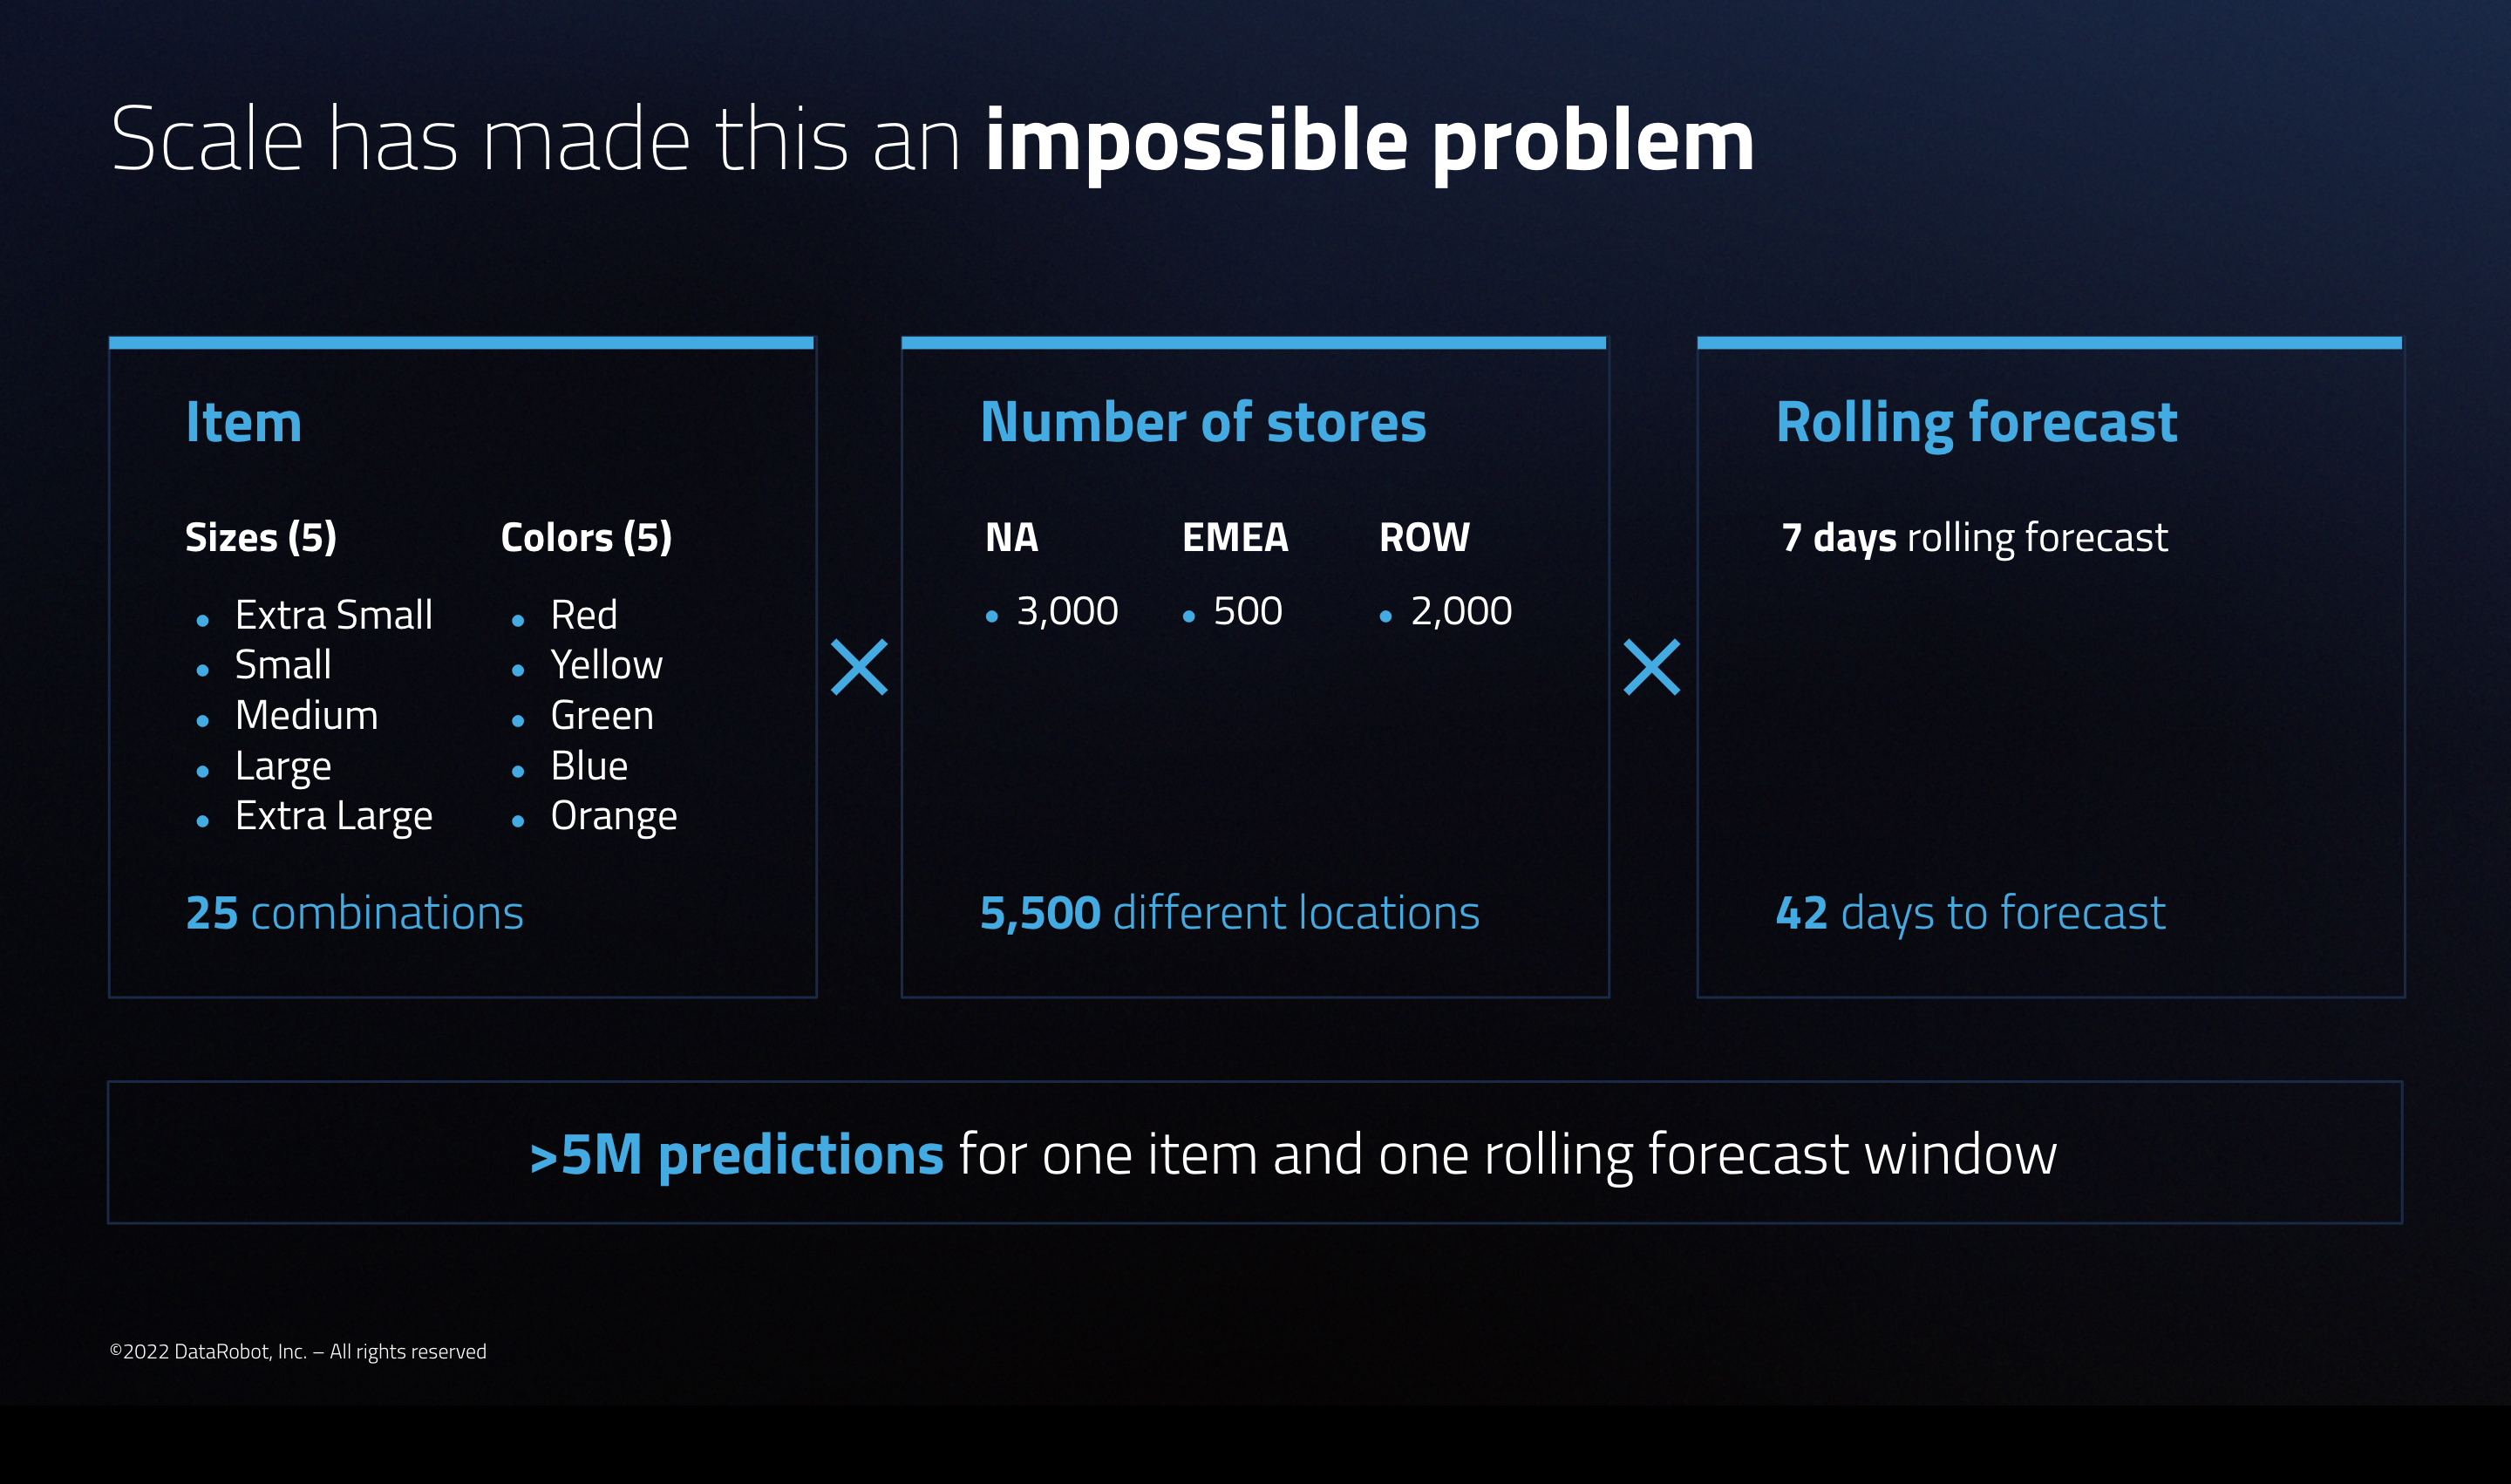
- Scale: Thousands of item combinations make it difficult to manually build predictive models
- Real-World Complexity: The constant changing conditions of demand swings, uncontrolled factors, such as the COVID pandemic, and internal activities are hard to forecast against and can render models useless overnight
- Integration and Disparate Tools: Within the same organization you might have different teams working with different technologies, tools, and frameworks, so there is a challenge in consistently of forecasting answers, making alignment more difficult and slowing down time to value
Why is it so difficult to do it manually? For example, just to forecast sales on a shirt with five different sizes in five different colors gives you 25 combinations. Now, add over 5,500 store locations with a 7-day rolling forecast—which actually takes 42 days to forecast—and you’ll get more than 5 million predictions.
This is where the DataRobot AI platform can help automate and accelerate your process from data to value, even in a scalable environment. Let’s run through the process and see exactly how you can go from data to predictions.
The use case will be forecasting sales for stores, which is a multi-time series problem—both supervised learning and time series regression. In this use case, the forecasting will be on a day resolution, but for other Time Series Forecasting, the resolution can be different, such as a month, a year, etc.
The process I will present will be using the DataRobot GUI. For code-first users, we offer a code experience too, using the AP—both in Python and R—for your convenience.
Setting up a Time Series Project
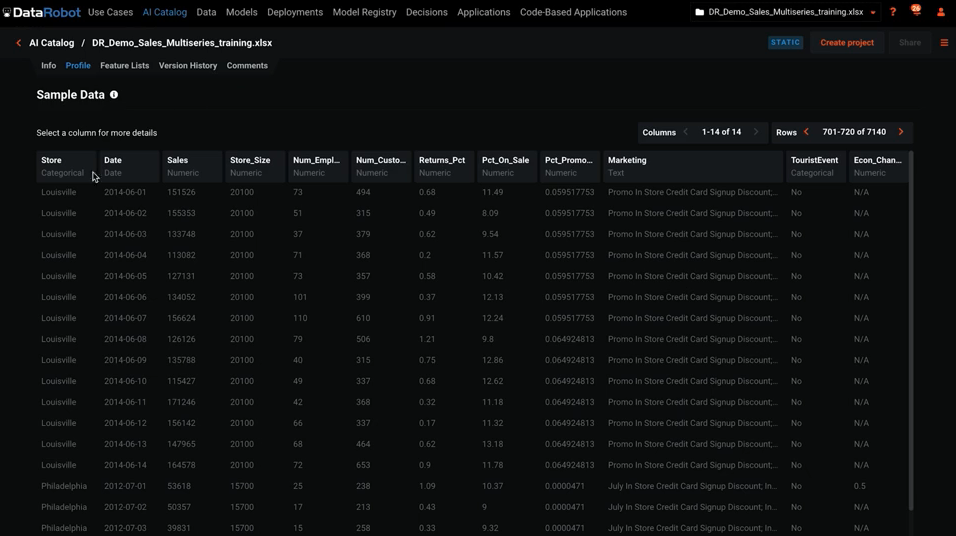
The machine learning life cycle always starts with the dataset. Import the data from various options: from a local file or URL or create a data connection with diverse data sources, such as Snowflake or Amazon Redshift, and upload it to the AI Catalog, which helps manage datasets, versioning, and shared capabilities with other users.
If your dataset is not in time order (time consistency is required for accurate Time Series projects), DataRobot can fix those gaps using the DataRobot Data Prep tool, a no-code tool that will get your data ready for Time Series forecasting.
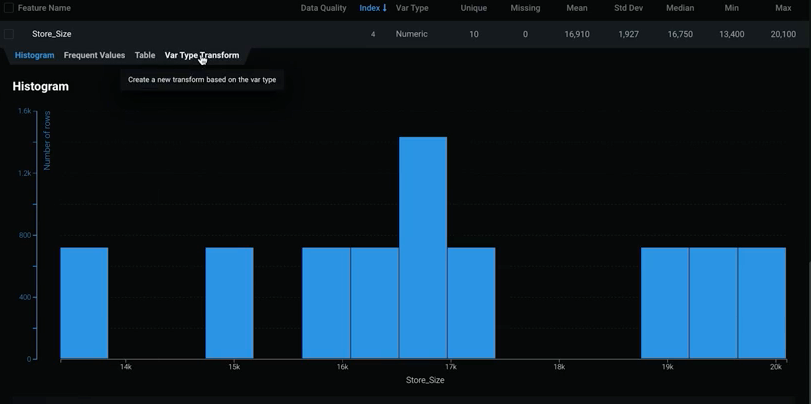
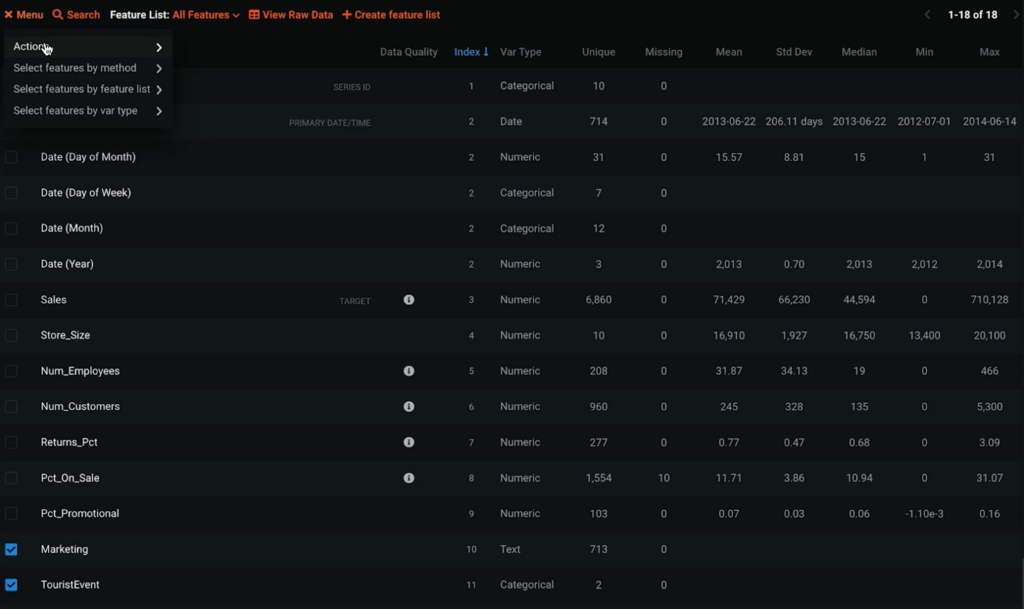
Once the data is ready, DataRobot will do some initial exploratory data analysis – in addition to a data quality assessment of the data – to get a deeper understanding of the dataset prior to model training. As you dive in, you can look at the distribution of each feature, identify outliers, target leakage, or missing data, create a var transformation, better understand what those features may be, and more.
Once the data is ready to start the training process, you need to choose your target variable. When we choose ‘sales’ it’s immediately recognized as a regression problem. Note: the DataRobot platform supports both supervised and unsupervised learning.
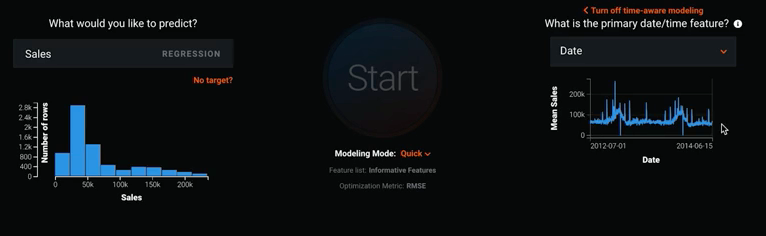
Next, you need to set up the time-aware modeling settings, including the Feature Derivation Window (FDW), or how long of a period you may need to generate features that would be relevant for your problem. Then generate a Forecast Window—which shows the futures period you want to forecast—and the operationalize gap (the period of time for which forecasted predictions can’t be made actionable).
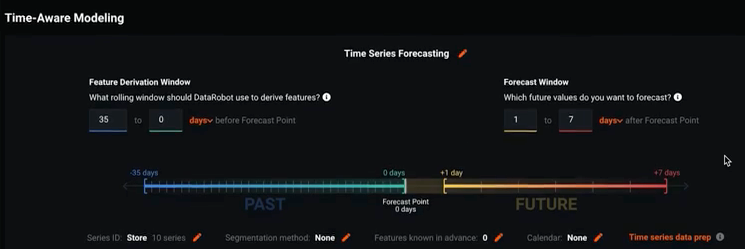
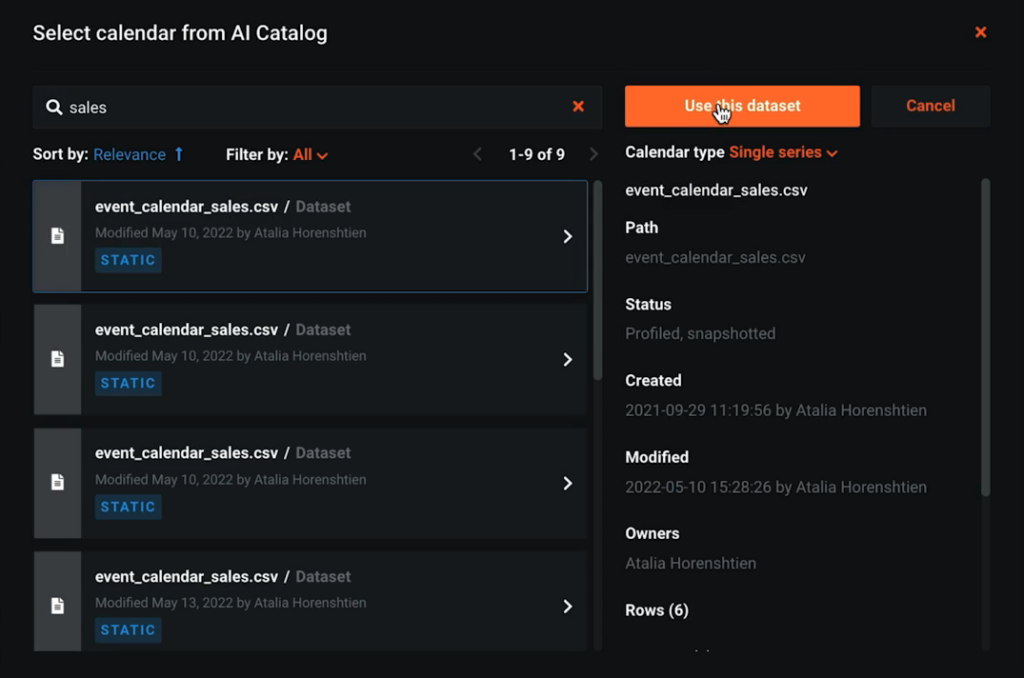
Calendars can also help you understand seasonality and incorporate it into the forecast model. For example, how holidays and events affect forecasting. If you don’t have your own calendar, DataRobot will generate one based on your location.
Advanced settings allow you to configure additional parameters to the forecasting project, like “known in advance” (KA) features—that don’t change after the forecast point—such as marketing promotions, tourist events, and more.
I could also configure the project based on segment, which will result in multiple projects “under the hood.” Once the segments are identified and built, they are merged to make a single-object—the Combined Model. This leads to improved model performance and decreased time to deployment.
The DataRobot Training Process
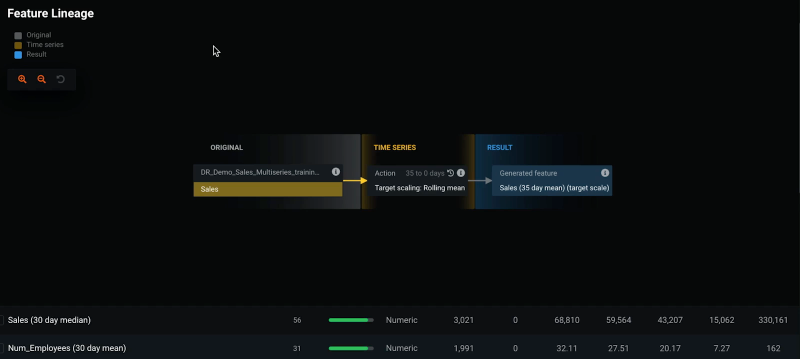
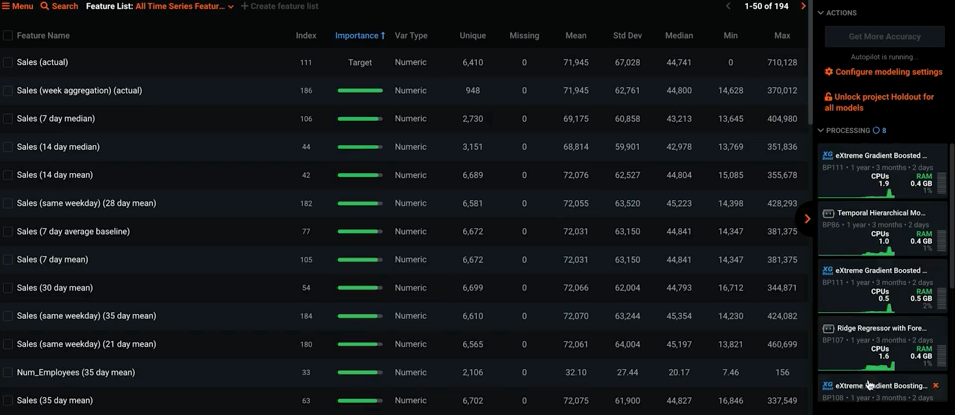
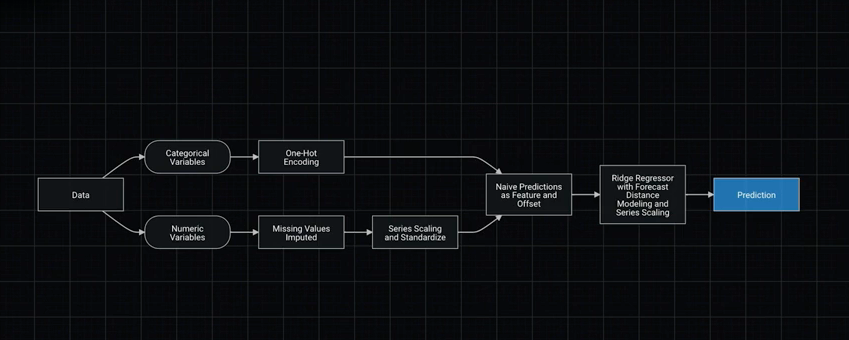
Now that all our settings are in place, we are ready to go. To begin training your model, just hit the Start button and let the DataRobot platform train ML models for you. Based on the FDW, new features will be generated. You can dive into each one of them and explore the feature lineage, allowing you to see the transformation from the original feature to the one that was created.
You can also see the correlation between each feature and the target variable. In the background, models are being trained in parallel for efficiency and speed—from Tree-based models to Deep Learning models (which will be chosen based on your historical data and target variable) and more.
To accelerate the process, you can also increase the number of modeling workers (number of jobs running at the same time).
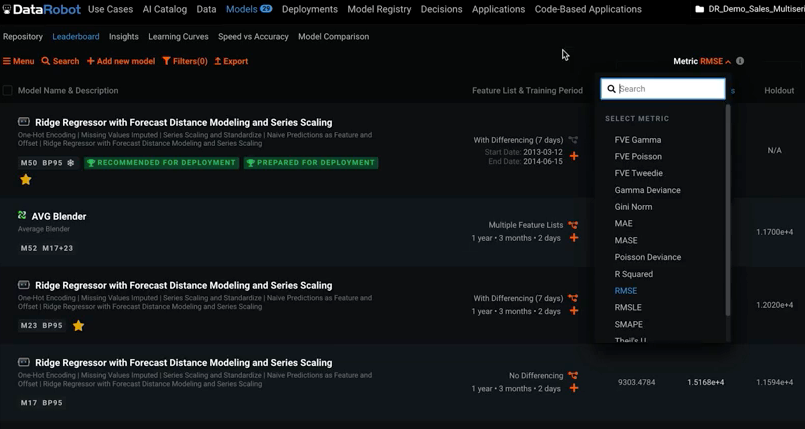
After your project has been finalized, you can review all the models that were trained. The order of the models will be based on the project’s metric—and can be changed based on your configuration. In the training process, different models with different feature lists and training periods were tested, and only the best performing models continued to the next round, resulting in the first model listed in the leaderboard, which is the recommended model by DataRobot for deployment.
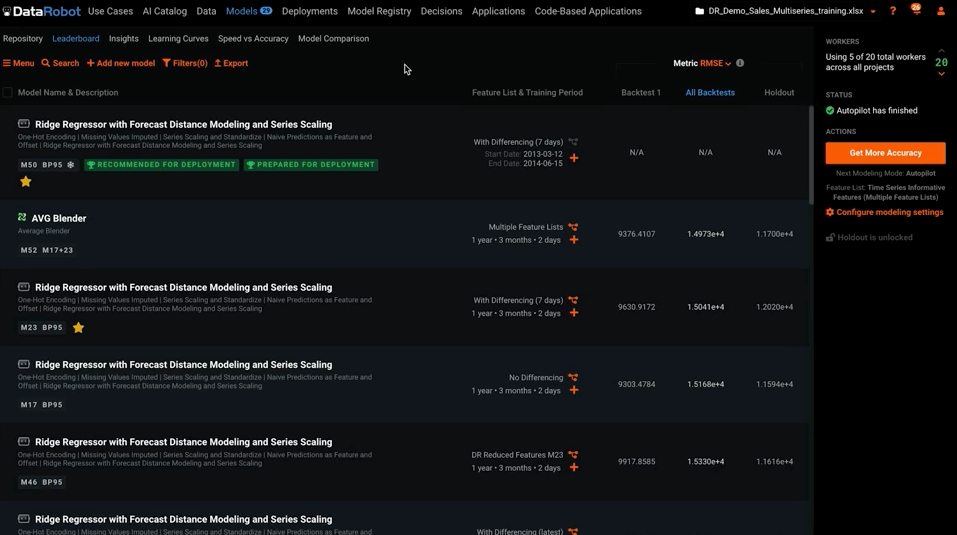
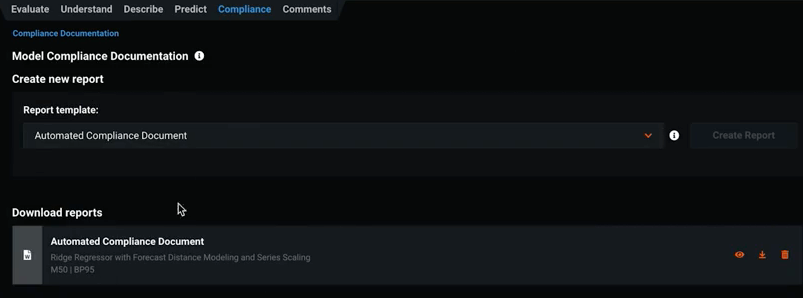
The model training process is not a black box—it includes trust and explainability. You can see the entire process from data to predictions with all of the different steps—as well as the supportive documentation on every stage and an automated compliance report, which is very important for highly regulated industries.
Model Performance, Insights, and Explainability
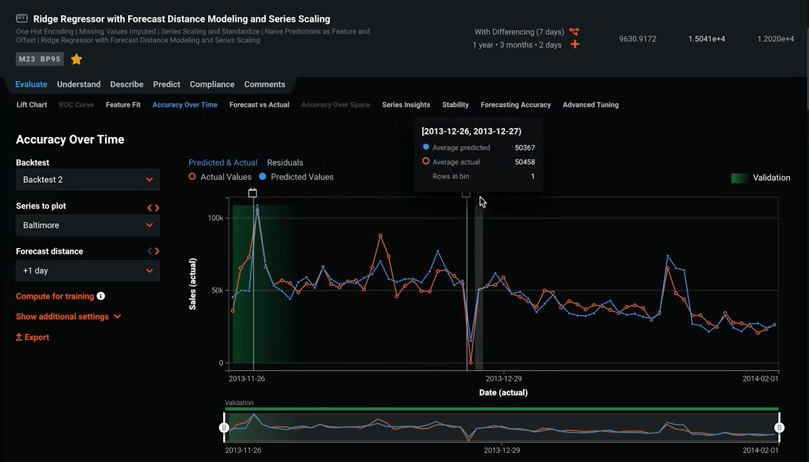
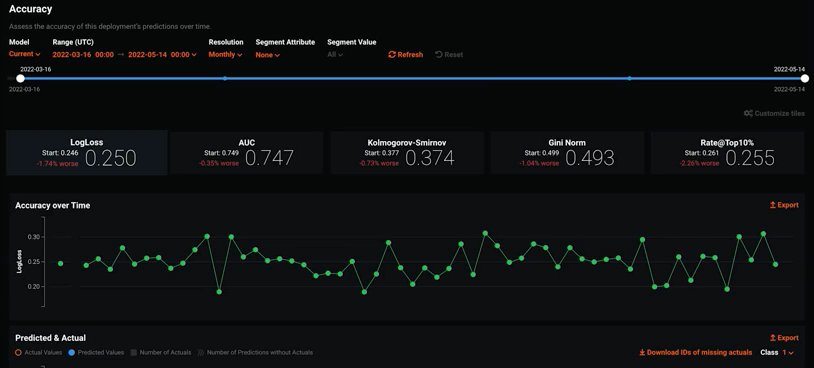
Do you want to see how your model is performing? Looking at Accuracy Over Time allows you to see the actuals versus the predictions of the model—and shows how seasonality and calendar events are incorporated. Advanced Tuning, meanwhile, will enable you to further tweak the model.
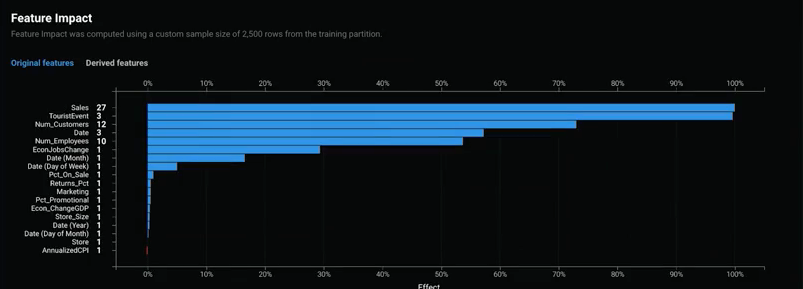
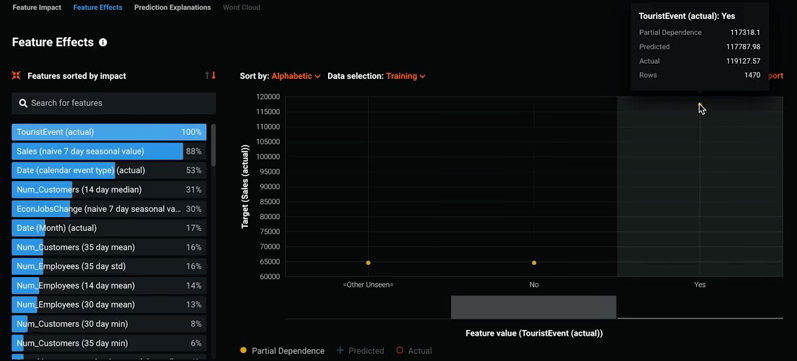
Are your business decisions aligned with the model results? On a macro level, see which features drive the model’s outcome. On a micro level, discover how a change in a specific feature affects the target variable. For example, choosing the ‘tourist event’ feature shows us that holding such events results in higher sales.
All of the from the platform can also be exported outside of DataRobot.
The Deployment Process
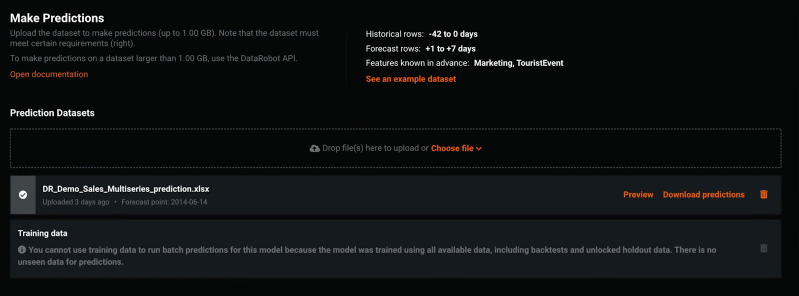
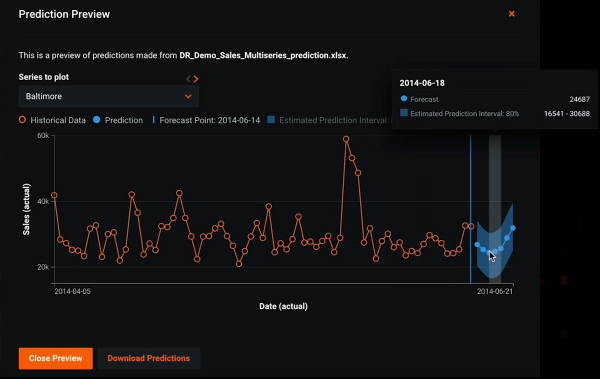
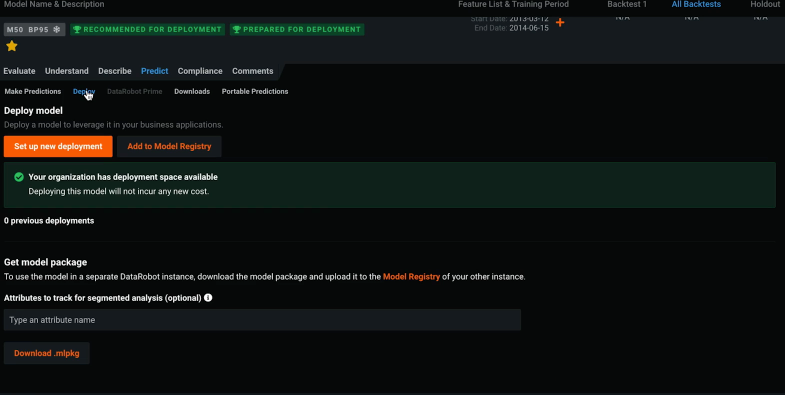
Now it’s time to put our model into production and get some predictions—and unlock real value and ROI. There are multiple ways to do so. Perform ad hoc analysis on your dataset and preview the predictions for the upcoming seven days for a specific series. You can also deploy the model using the DataRobot API—ensuring a smooth and fast connection between data scientists and the IT team.
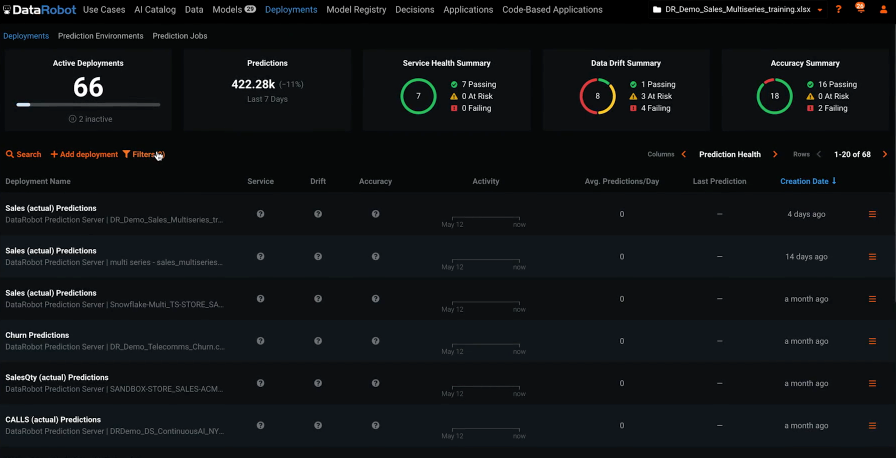
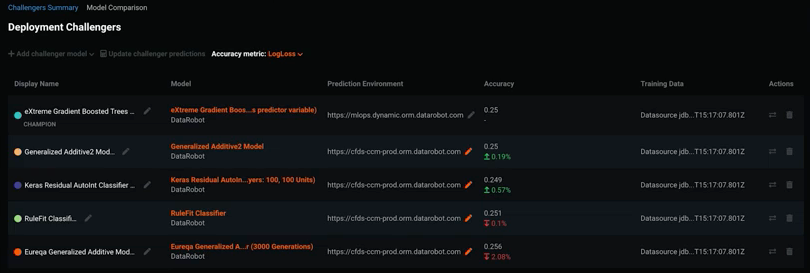
In general, using DataRobot MLOps, you can also see models that you currently have in production—from different training and deployment environments. Check for model accuracy and data drift and inspect each model from governance and service health perspectives, respectively. If your model is decaying, you can replace it with a more accurate challenger model—which can be monitored with automatic rules and notifications.
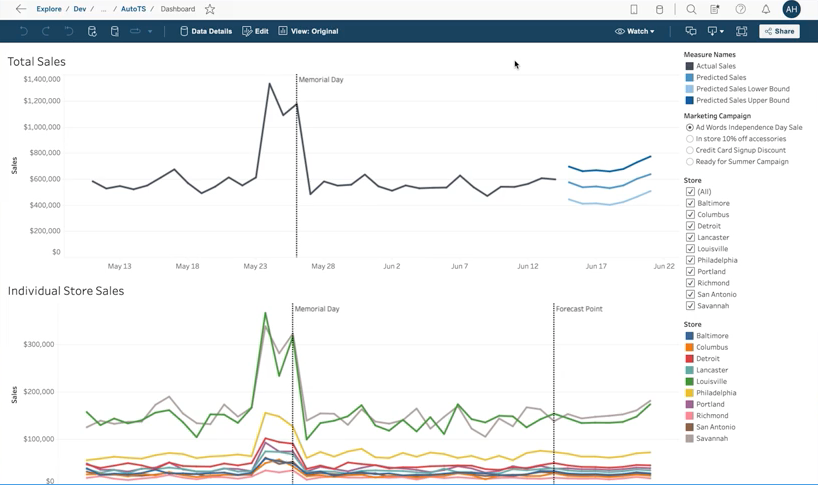
Close the loop by connecting your predictions into any database—including batch or real-time predictions using the DataRobot API. And to connect to the business, you can connect predictions to your business application. For example, I used Tableau in this use case. On the top, you can see the overall forecasted sales for the next seven days in all the stores combined, and on the bottom, you have each series (each store) displayed individually.
Accelerate the Machine Learning Life Cycle with AI-Powered Forecasting
Time Series Forecasting might be the most powerful aspect of machine learning available to organizations today. The ability to strategically plan for what’s to come can set you apart from your competition.
With accessibility from the UI, but also from code—and with Trusted AI and explainability to help increase the value and unlock ROI—the DataRobot platform can help your organization quickly make accurate predictions and get actionable insights.
To see a demo on how you can leverage AI to make forecasting better, and accelerate the machine learning life cycle, please watch the full video, AI-Powered Forecasting: From Data to Consumption.

Atalia Horenshtien is a Global Technical Product Advocacy Lead at DataRobot. She plays a vital role as the lead developer of the DataRobot technical market story and works closely with product, marketing, and sales. As a former Customer Facing Data Scientist at DataRobot, Atalia worked with customers in different industries as a trusted advisor on AI, solved complex data science problems, and helped them unlock business value across the organization.
Whether speaking to customers and partners or presenting at industry events, she helps with advocating the DataRobot story and how to adopt AI/ML across the organization using the DataRobot platform. Some of her speaking sessions on different topics like MLOps, Time Series Forecasting, Sports projects, and use cases from various verticals in industry events like AI Summit NY, AI Summit Silicon Valley, Marketing AI Conference (MAICON), and partners events such as Snowflake Summit, Google Next, masterclasses, joint webinars and more.
Atalia holds a Bachelor of Science in industrial engineering and management and two Masters—MBA and Business Analytics.
-
How to Choose the Right LLM for Your Use Case
April 18, 2024· 7 min read -
Belong @ DataRobot: Celebrating 2024 Women’s History Month with DataRobot AI Legends
March 28, 2024· 6 min read -
Choosing the Right Vector Embedding Model for Your Generative AI Use Case
March 7, 2024· 8 min read
Latest posts
