
Bridging the Gap: How ‘Data in Place’ and ‘Data in Use’ Define Complete Data Observability
In a world where 97% of data engineers report burnout and crisis mode seems to be the default setting for data teams, a Zen-like calm feels like an unattainable dream. Complaints from dissatisfied customers and apathetic data providers only add to the mounting stress. One of the primary sources of tension? The uncertainty of not knowing where data issues will crop up next and the tiresome game of ‘who’s to blame’ when pinpointing the failure. This is where the true power of complete data observability comes into play, and it’s time to get acquainted with its two critical parts: ‘Data in Place’ and ‘Data in Use.’ It’s not just about playing detective to discover where things went wrong; it’s about proactively monitoring your entire data journey to ensure everything goes right with your data. Because let’s face it, your customers don’t care where the problem originated—they want it fixed and fast.
What is Data in Place?
Data in Place refers to the organized structuring and storage of data within a specific storage medium, be it a database, bucket store, files, or other storage platforms. In the contemporary data landscape, data teams commonly utilize data warehouses or lakes to arrange their data into L1, L2, and L3 layers. L1 is usually the raw, unprocessed data ingested directly from various sources; L2 is an intermediate layer featuring data that has undergone some form of transformation or cleaning; and L3 contains highly processed, optimized, and typically ready for analytics and decision-making processes. These layers help teams delineate different stages of data processing, storage, and access, offering a structured approach to data management.
In the context of Data in Place, validating data quality automatically with Business Domain Tests is imperative for ensuring the trustworthiness of your data assets. Rigorous data quality tests, such as Schema tests to confirm that the data structure aligns with the expected schema, Freshness tests to ensure the timeliness of the data, and Volume tests to validate the quantity of ingested data, should be a standard procedure. Moreover, advanced metrics like Percentage Regional Sales Growth can provide nuanced insights into business performance. Running these automated tests as part of your DataOps and Data Observability strategy allows for early detection of discrepancies or errors. This proactive approach to data quality guarantees that downstream analytics and business decisions are based on reliable, high-quality data, thereby mitigating the risks associated with poor data quality.
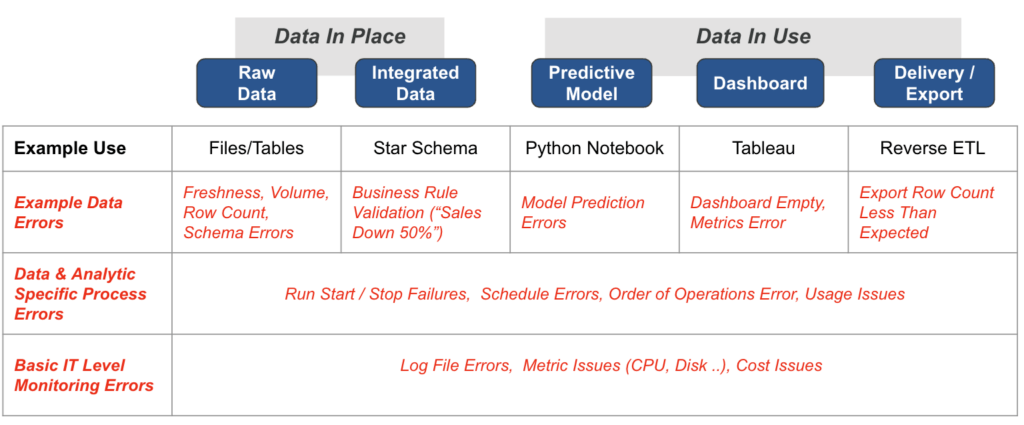
Levels of Monitoring of Problems in Data Analytic Systems
What is Data in Use?
Data in Use pertains explicitly to how data is actively employed in business intelligence tools, predictive models, visualization platforms, and even during export or reverse ETL processes. These applications are where the rubber meets the road and often where customers first encounter data quality issues. Problems can manifest in various ways, such as Model Prediction Errors in machine learning applications, empty dashboards in BI tools, or row counts in exported data falling short of expectations. Given this, it’s crucial to have in Place meticulous inline production data validation testing for the results of models, visualizations, data delivery mechanisms, and overall data utilization. Each of these tools can contain simple or complex logic that may be incorrect. This focus on evaluation and testing should be relentless and critical in the ‘last mile’ of the Data Journey. In this last stretch, the data is at its most valuable state and where its quality—or lack thereof—becomes immediately apparent to end-users. Don’t hope your dashboard is correct — write a production test to ensure it is!
The ultimate value proposition here is an enhanced experience for the end-user. Data engineers ensure that all the ingested, processed, and transformed data culminates in actionable, reliable products—be it a predictive model, a dashboard, or a data export. After navigating the complexity of multiple systems and stages to bring data to its end-use case, the final product’s value becomes the ultimate yardstick for measuring success. By diligently testing and monitoring Data in Use, you uphold data integrity and provide tangible value to end-users. Failing to ensure this quality through the last mile would be akin to running a marathon and stopping just shy of the finish line. Therefore, robust evaluation mechanisms are not just an added layer of scrutiny; they are essential to the data’s lifecycle and are critical for delivering genuine value to the customer.
What Is The Challenge Of Not Observing Both Data In Place And Data In Use?
One of the most vexing challenges that data engineers face in today’s complex data ecosystems is the difficulty in quickly identifying issues across both ‘data in place’ and ‘data in use,’ as well as down the stack. When data-related problems arise, they often trigger exhaustive, stressful group investigations to pinpoint the source of the issue, draining team productivity and morale. For instance, imagine the Head of Data at a top 20 revenue-generating company in the United States receiving an urgent call from the CEO about an empty compliance report. This results in rallying 26 team members—likely the cream of the crop—to spend an entire day investigating the problem, only to discover that a single blank field passed through the data pipeline was the culprit. This scenario is not just a narrative about a wasted day or the embarrassment of the Head of Data; it exemplifies a systemic issue that can plague even the most advanced data teams, leading to finger-pointing and an erosion of trust within the team and with stakeholders.
The repercussions of such incidents are multi-faceted. At a surface level, they lead to immediate loss of productivity, as skilled engineers and analysts are pulled from their regular tasks to engage in a “data problem finding” scavenger hunt. However, the more profound impact is far more corrosive; it fosters a blame culture, undermines team cohesion, and diminishes customer and stakeholder trust in data quality. When issues can’t be diagnosed and resolved efficiently, it casts a shadow on the reliability of the entire data infrastructure. For companies where data is a critical asset, this erosion of trust can have long-term business implications, compromising decision-making and strategic initiatives. Therefore, investing in robust DataOps practices and automated testing can act as both a preventative measure and a confidence-building exercise, ensuring that data remains a source of strength rather than a point of vulnerability.
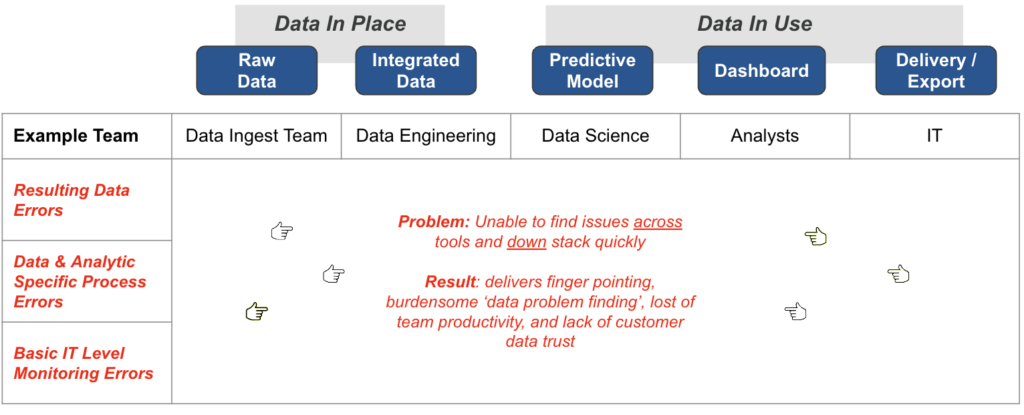
Multiple Problem Locations in Data Analytics Production
Where Do Current Data Observability Tools Stand with Data in Place and Data In Use?
The current landscape of Data Observability Tools shows a marked focus on “Data in Place,” leaving a significant gap in the “Data in Use.” When monitoring raw data, these tools often excel, offering complete standard data checks that automate much of the data validation process. However, their capabilities can be limited for integrated data, requiring manual configurations and auto-generated testing capabilities. Vendor-specific offerings may provide some degree of data process error monitoring in Data in Place, focusing on data orchestration tools and logs, metrics, and status reports. However, these capabilities can be highly variable, and while some tools offer Service Level Agreement (SLA) checks, others may need to monitor for order of operations errors in data processes.
This existing paradigm fails to address the challenges and intricacies of “Data in Use.” For example, these tools may offer metadata-based notifications. Still, they cannot perform actual data-in-use testing, which is crucial for applications like Business Intelligence tools, predictive models, and export/reverse ETL processes. The production-time monitoring of these observability tools often falls short, failing to provide order of operations error checking or SLA compliance checks. This leaves data engineers in the dark regarding ensuring the quality and reliability of data once it has left its storage medium and is actively being used in various applications. The existing tools only solve half the problem, calling for a more comprehensive approach to data observability encompassing Data in Place and Data in Use.
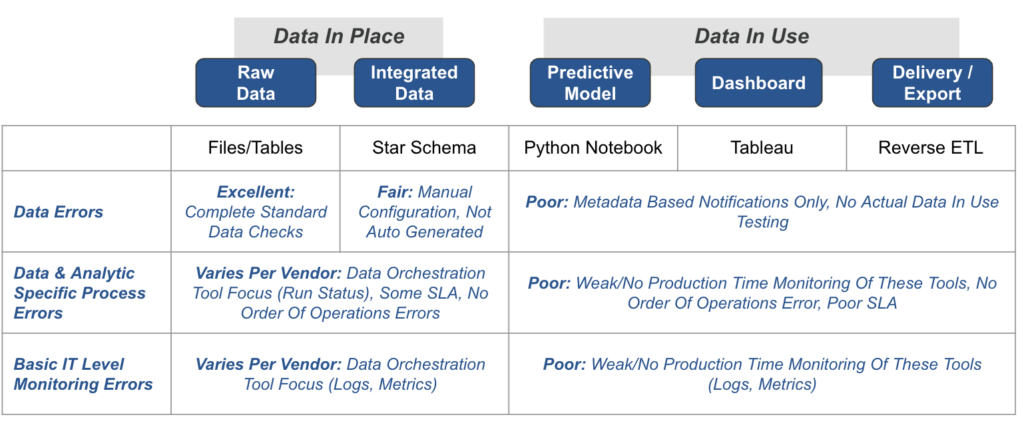
Current Data Observability Falls Short
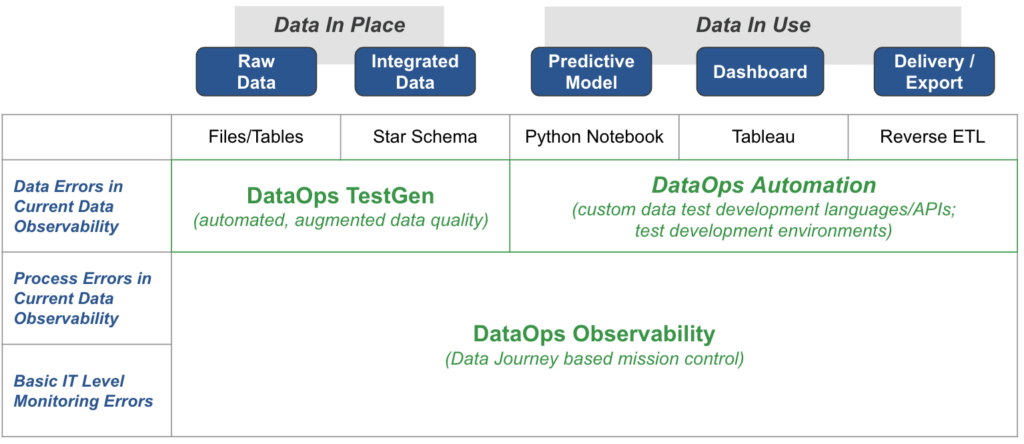
What does a complete Data Observability Solution look like? DataKitchen
A complete Data Observability Solution should encompass a holistic approach beyond merely focusing on Data in Place and Data in Use. A robust solution should adhere to the Five Pillars of Data Journeys, which provide a comprehensive framework for tracking and monitoring data throughout its lifecycle. The first pillar stresses the need for understanding the sequence of data operations, including routine checks and maintaining the correct order of operations. The second pillar emphasizes the need to monitor metrics, logs, and costs to ensure that data operations are efficient and cost-effective—the third pillar advocates for automated data quality validation tests to enhance data integrity and reliability. The fourth pillar focuses on testing the results of data models, visualizations, and other applications to validate Data in Use. The fifth pillar encourages setting benchmarks and comparing actual results against these expectations through alert systems and in-depth analyses.
DataKitchen’s suite of products offers a robust implementation of these Five Pillars of Data Journeys. They provide a comprehensive observability solution that tracks and monitors all aspects of the data stack—from the raw data to the tools, servers, code, and tests that interact with it. Their products offer real-time status updates and alerts on various metrics such as start times, processing durations, test results, and infrastructure events. This level of granularity ensures that teams can quickly ascertain whether operations have been executed flawlessly or identify the components that have faltered, enabling prompt remediation.
DataKitchen’s DataOps Observability provides an abstraction for the Data Journey, including expectations, alerts, and analysis. DataOps TestGen adds another layer of security by offering in-database data testing results, which are then shared with DataOps Observability for a unified view. Lastly, DataOps Automation takes care of tool, model, and API-level testing and integrates these results with DataOps Observability. This synergistic combination of products ensures that data engineers have a panoramic view of their data environment, helping them anticipate issues, make informed decisions, and ultimately deliver more value to the end-users.
Do you want to observe Data In Place and Data In Use? Contact DataKitchen Today!
DataKitchen Complete Data Observability Software


