15 Most Common Data Science Interview Questions

Introduction
Job interviews are…well, hard! Some interviewers ask hard questions while others ask relatively easy questions. As an interviewee, it is your choice to go prepared. And when it comes to a domain like Machine Learning, preparations might fall short. You have to be prepared for everything.
While preparing, you might have stuck at a point where you wonder what more shall I read. Well, based on almost 15-17 data science interviews that I have attended, here I have put 15, very commonly asked, as well as important Data Science and Machine Learning related questions that were asked to me in almost all of them and I recommend you must study these thoroughly. This will help you utilize your time efficiently and focus on what is important rather than wandering across the web to search for questions and answers to them.
15 Most Common Interview Questions
1. Explain the Difference between Classification and Regression with at least 1 example.
Ans. As the name suggests, Classification algorithms classify the output variables into two or more classes or categories so that they become discrete values. Whereas, Regression algorithms calculate continuous and real values, unlike Classification algorithms.
Explain this difference using an example. Using classification, a company can predict whether an employee might resign or not in the next 5-10 years, using their data, like their salary, bonus, work experience, their age etc. Using regression, the same company can analyse their product demand, analyse product manufacturing errors etc. using their product purchase history, customer satisfaction, returns, complaints etc.
2. Which is your favourite clustering algorithm? Explain why.
Ans. My favourite clustering algorithm is K-Means Clustering. The simplicity of this algorithm draws my attention. In K-Means all we have to do is these simple 4 steps-
1. Choose k number of clusters.
2. Specify the cluster seeds.
3. Assign each data point to a centroid
4. Adjust the centroids
By these steps, K-Means can scale according to the dataset and is also very efficient. The results are easy to interpret too.
Moreover, the elbow method is a very interesting and simplistic approach to optimise the K-Means algorithm taking account of the WCSS (Within Cluster Sum of Squares) Vs. the k number of clusters, which always produces a curve that looks like an elbow!
.png)
The elbow point value is the optimal number of clusters for your data! It greatly improves your model performance in a very elegant yet easy way, which I admire!
3. What is the generalized equation of a supervised Machine Learning model and explain it in your own words.
4. What is bootstrap sampling? How is it useful in ML? Explain with a use-case.
In Machine Learning, bootstrap sampling is used in an ensemble algorithm called bootstrap aggregation or Bagging. It helps avoid overfitting and improves the stability of a Machine Learning algorithm.
For example, the Bootstrap Aggregation algorithm helps create multiple different models from a single training dataset. A very popular use case is predicting election results for an area using sample data instead of taking election data of the entire population.
5. What are overfitting and underfitting? Explain in terms of statistic terminologies and suggest measures to reduce both.
Underfitting occurs when a Machine Learning model neither fits on the training data nor generalizes to the new data to test on. The model fails to recognize the underlying trends of the data. It usually happens when we have very fewer data to build an accurate model, also when we try to build a linear model with fewer non-linear data. Statistically, underfitting occurs due to high bias and low variance. Underfitting can be reduced by using other Machine Learning algorithms, fitting more data, removing noise from data, increasing the number of features by performing feature engineering etc.
6. Define Euclidean, Manhattan and Minkowski distance. In what kind of problems are they used and why?
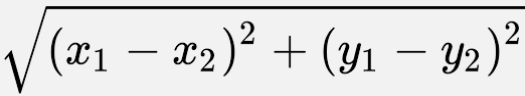
Manhattan distance: Manhattan distance between two points in an n-dimensional space is the sum of the distances in each dimension. Consider two points A(x1, y1) and B(x2, y2) in the cartesian plane. The Manhattan distance between them is represented as:
.png)
Minkowski distance: Minkowski distance is a generalized form of Euclidean and Manhattan distances. For two points A(x1, x2) and B(y1, y2) the Minkowski between them is:
7. Describe what you mean by bias-variance trade-off in ML.
On the other hand, variance is how varied predictions our model is doing. In a space where data points are widely scattered, the model tries to learn every data point so perfectly that instead of recognizing patterns, it becomes more like a forcefully memorizing them. Memorization will only lead to good performance as long as it is predicting training data’s outputs. As soon as we give new unknown data to predict, it will give an error. Such behaviour occurs when the model tries to fit the noise and fluctuations (variance). It introduces overfitting.
So bias and variance are opposites to each other, and the trade-off is simply computing the balance between bias and variance so that error is minimised. Whenever we have a low bias, variance increases and vice versa. So, we have to model in a way that bias and variance both stay balanced and neither overfitting nor underfitting occurs. Such kind of tuning is called Bias Variance Tradeoff.
8. What is Vectorization? Why is Vectorization important in NLP use cases?
In NLP, Vectorization is used to map words or phrases from vocabulary to a corresponding vector of real numbers to enable word predictions, word similarities/semantics and grammar checks.
9. Mention some differences between covariance and correlation.
b. Correlation measures how two variables are related to each other and by how much. Covariance measures whether a variation in one variable results in a variation in another variable.
c. Changing the scale of variables affects covariance i.e. if the variables are changed using similar or different constants, the calculated covariance between the variables changes. But in the case of correlation, this doesn’t happen. Correlation is not affected by a change of scale.
10. Why is the Naive Bayes algorithm, naive? Mention its advantages and disadvantages.
Advantages
1. Extremely easy to implement and follows a simple probabilistic approach (Bayes’ Theorem).
2. Works great in small datasets, and can classify stuff even when no data is there!
3. Massively used for spam-filtering and specially text-classification tasks ( as it works better when attributes/features in data are independent of each other).
Disadvantages
1. Works poorly with numerical data, as numerical data is mostly normally distributed.
2. The ‘naive’ approach to considering attributes independent of each other, doesn’t often work well in complex problems.
11. Explain a decision tree. What do you know about the ID3 algorithm?
In the decision tree, ID3 stands for Iterative Dichotomiser 3. Dichotomiser means dividing. The algorithm is used for feature selection in a decision tree by the top-down greedy approach (builds the tree from the top and selects the best feature at each step iteratively using Entropy/Information Gain). Each parent node is divided into one or more child nodes iteratively till no more division is possible.
12. Entropy or Gini Impurity? – define them and decide which is better for selecting the best features in your data.
Gini Impurity: Like Entropy, Gini impurity also measures the impurity of a variable or how good a node is split. In both, Entropy and Gini impurity, a node that has multiple classes is considered impure and a node having a single class is pure.
.png)
If we compare both the methods then Gini Impurity is more efficient than entropy in terms of computing power. Training time when using the Entropy criterion is much higher because Entropy is calculated using logarithms. Hence, Gini impurity must be preferred over Entropy.
13. What are leaf nodes in the Decision tree?
14. What are the disadvantages of the Decision tree?
b. It tends to become more complex when we add more data to it. Upon adding new data points, the nodes get calculated again and the tree is restructured. This reduces the efficiency of the model. Hence, for time-series analysis, the Decision tree is not used. Random forest is used instead.
c. Decision tree is vulnerable to noisy datasets. It tries to fit all the data including the noisy data, and later tends to give wrong predictions.
15. Explain Information Gain in the Decision tree algorithm with its mathematical formula.
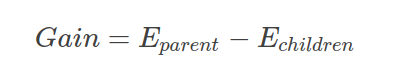
Here, Eparent is the entropy of the parent node, and Echildren is the entropy of the child nodes.
Tips for Interviews
Some tips to bear in mind before attending/during data science interviews-
- Always remember to explain your answers with a pen and paper using graphs/formulas as proof of concepts in an interview. It increases your chance of getting selected as data scientists are much preferred to be extremely detailed with whatever they do! Hence, such a storytelling habit must reflect in your interviews.
- Avoid the use of abbreviations like ML/DL/NLP/CV if you are sitting for an entry-level role interview. Be as much thorough as you can.
- Try to not put skills or frameworks that you have used barely 1-2 times and only put those you extensively work with.
- Try to be honest and humble while answering questions. Learn to humbly address that you don’t know the answer to a particular question asked rather than covering it up with irrelevant information. Most of the time candidates get rejected for such arrogant behaviour.
- Be friendly yet professional. Have confidence and don’t show up with a “stressed” and “anxious” face.
Conclusion on Interview Questions
Hope this article will help you get a quick and efficient revision before your gruelling data science interviews.
Key takeaways from this article are-
- You learned about very important concepts like bias-variance tradeoff, classification, regression etc.
- The pros and cons of one of the most used classifiers Naive Bayes.
- Important concepts like Entropy and Gini Impurity in Decision trees.
- Very crucial mathematical and statistical concepts like covariance and correlation, vectorization, and distance metrics.
- Overfitting Vs Under-fitting which is a MUST to know concept for any machine learning enthusiast.
Cheers and all the best! Hope you ace your data science interviews!
The media shown in this article is not owned by Analytics Vidhya and is used at the Author’s discretion.


