Top 10 Tableau Projects for Data Science
Introduction
The world of data science has numerous candidates with technical expertise, but only a few excel at problem-solving. When it is about communicating and expressing these skills effectively, some people are great at it naturally, while others develop this ability over time. Fortunately, with the advent of tools such as Tableau, you get access to multiple options for easy visualization. In this context, let’s explore the top 10 Tableau projects for data science. These will enhance your visualization skills, amplify your problem-solving capabilities, and help you present your hands-on experience before potential employers.
Table of contents
Beginner Level Tableau Sample Projects Ideas
If you are looking for some beginner-level Tableau projects, look no further. Here is a list of some of the simplest projects:
Patient Risk Healthcare Dashboard
Candidates in the healthcare domain can use patient data to analyze the possible risks, thus performing predictive modeling in Data Science. It would be best to begin with gathering essential information and diseases associated with the patients in a specific hospital or based on any other criteria of your choice. The analysis can predict the risk to health, onset of a particular disease, or treatment time. Begin designing the patient risk healthcare dashboard through lines, bar charts, and scatter plots.

Sales Forecast Analysis Dashboard
The project encourages expertise in Data Analysis and Data Science at the beginner level and is effective for Tableau projects for resumes. You can go forward with this category by creating or taking the information, such as the quantity of sales by each team or department of any company. Use it to analyze and predict the sales in the next period for specific items. Forecast the values using different tools and provide rational ideas based on your interpretation. Work out the dashboard with time-series line charts for sales trends, bar charts for actual quantifiable sales, and trend lines for analytical purposes.
Marketing Campaign Dashboard
You can work on marketing data to analyze the performance of different marketing campaigns. As a result, you can suggest options to continue specific marketing campaigns or halt some. Go forward with variables comprising different data types like questions, types of segments, and varying descriptions of each. Find other related information like answers and count, and perform your analysis. Ensure depicting the summarized information using trend-wise analysis for better understanding. You can take help from pie charts to show segment distribution, while bar charts will be appropriate for campaign performance. The marketing campaign-related visualization is in high demand.

Flight Price Analysis Dashboard
The aviation industry utilizes data visualization. One of the best Tableau projects for resumes in this industry is the problem statement for predicting flight prices. The practice project here will be an uplevel owing to multiple data types and variables leading to a specific result. It will also involve Exploratory Data Analysis and identifying hidden patterns, followed by implementing prediction models. The latter will be best described and summarized by scatter plots, while heat maps can be used for price variations.

Crime Analysis Dashboard
Another beginner-level project that involves multiple variables is essential to analyze the trend and predict. It is also effective in formulating strategies by understanding the next action of the criminal. Do consider including the intensity or any other parameters that add to the relevance of the dataset and urgency for solving the project. Add in the treemap while visualizing the data and seek period-based patterns for deeper understanding. Scatter plots for correlation, line charts for trend analysis, and treemaps for crime distribution are common ideas for the crime analysis dashboard.

Air Quality and Pollution Analysis Dashboard
The project solution can be showcased for experience and to show Tableau projects in the Environment Protection Industry. You can opt to analyze datasets concerning any type of pollution or pollutants in any particular area. The analysis will dive into the causes and predict the appropriate measures. It also focuses on identifying the right actions. The dashboard thus created can compromise multiple charts like bar and line charts, among other options.

Intermediate Level Tableau Project Ideas
When applying for positions requiring some experience, consider the following projects:
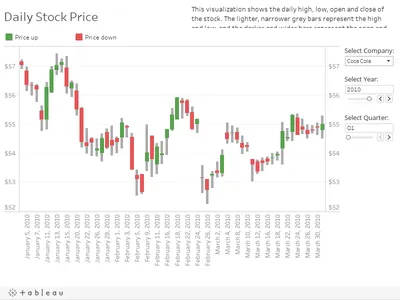
Stock Exchange Analysis Dashboard
Used in market settings, the stock exchange analysis helps in decision-making. You can create a Tableau projects GitHub dashboard that holds comprehensive information on current market trends in a specific place. The presented information can include indices through area charts, trend charts, stock or market analysis, equities, and other related information through candlestick charts or heatmaps. The appropriate visualization based on frequent changes will be required here. You can also expect familiarity with large data volumes in this sector.
Global Terrorism Analysis Dashboard
The experience and learned skills through this project will help the government. The created visualization can assist in taking righteous actions to help the countries fight against terrorism with the right strategies curated through pattern identification. It will also involve depicting maps for better identification, followed by representing through line graphs and horizontal bar graphs.

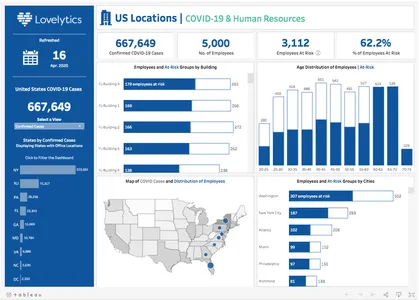
COVID-19 Analysis Dashboard
Another practical and healthcare-based project to exhibit the ability to deal with the health industry. The Tableau projects GitHub dashboard can be used for prediction in different regions while providing real-time analysis. It has been used in actual COVID-19 depictions. The visualization was capable of separately showing the overall spread of large data volumes with different intensities and different other measures as per the requirement. For additional ideas, you can take help from here- use geospatial maps to depict spread visualization, heatmaps for intensity, and line charts for daily cases.
Advanced Level Tableau Project Ideas
The following Tableau project ideas will help you convince potential employers of your expertise in the domain:
Credit Card Fraud Detection Dashboard
The banking sector leverages the power of data science to detect fraud while learning about the trends and associated patterns. You will create the dashboards here through Exploratory Data Analysis to perform those above. The process will involve detecting anomalies across different cards. The representation will include boxplots for easy outlier identification, line charts for transaction trends, and scatter plots for fraud patterns.

Twitter Sentiment Analysis Dashboard
Social media analysis is possible, such as creating a dashboard for Twitter sentiment analysis. Showcase these Tableau projects for resumes. You can take an idea for the project by selecting a few posts and analyzing the sentiments. The inference drawn will decide the actions to be taken in the future. Considering other examples, the dashboard can express word clouds for sentiment visualization, stacker area charts for sentiment trends, and line charts for tweet volume.

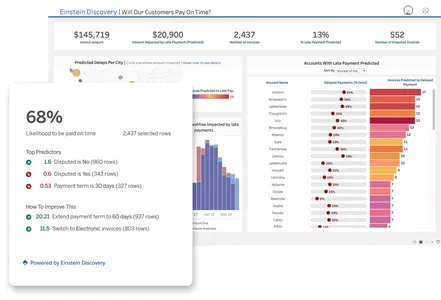
Account Management Dashboard
The dashboard created here must be of relevance to account managers. Your aim will be to perform account management with a clear description of each account and associated information. The data to be represented can vary between small to large volumes, where comparative bar charts can help. Alternatively, you can also consider heatmaps for account activity, bar charts for account status, and Sankey diagrams of transaction flows.

Conclusion
Tableau is an effective visualization tool commonly used among Business Intelligence Analysts, Data Analysts, Data Scientists, Business and Healthcare Analysts, Financial Analysts, Marketing and IT professionals, Researchers, and many more professionals. It provides a user-friendly interface with multiple options for robust data visualization and decision-making. Strive to gain experience by choosing the appropriate dashboard idea, depending on your level.
Frequently Asked Questions
Ans. Tableau is primarily a data visualization tool, but it’s often used in data science for visualizing and exploring data. Data scientists can benefit from its intuitive interface and integration with various data sources.
Ans. Tableau is used to create interactive and visually appealing data visualizations and dashboards. It helps businesses make data-driven decisions, analyze trends, and communicate insights effectively.
Ans. Yes, Tableau professionals are in high demand as organizations seek to leverage data for decision-making. It’s a valuable skill in data analytics and business intelligence fields.
Does Tableau require coding?
Ans. Tableau doesn’t require coding for basic tasks. However, some advanced functions may involve scripting in languages like SQL or R, but it’s not mandatory for most users.


