How to Build a Data Warehouse Using PostgreSQL in Python?
This article was published as a part of the Data Science Blogathon
Introduction
Data warehouse generalizes and mingles data in multidimensional space. The construction or structure of a data warehouse involves Data Cleaning, Data Integration, and Data Transformation, and it can be viewed as an “important preprocessing step for data mining”.
Furthermore, data warehouses provide online analytical processing (called OLAP) tools for the interactive analysis of multidimensional data of diverse granularities, which facilitates effective data generalization and data mining. There are many other data mining functions, such as association,
classification, prediction, and clustering, that can be integrated with OLAP operations to enhance interactive mining of knowledge.
That’s why the data warehouse has become an escalated important platform for data analysis and OLAP. The data warehouse will provide a constructive platform for data mining. Therefore, data warehousing and OLAP form an essential step in the knowledge discovery process(KDD). This is the overview that is essential for understanding the overall data mining and knowledge discovery process.
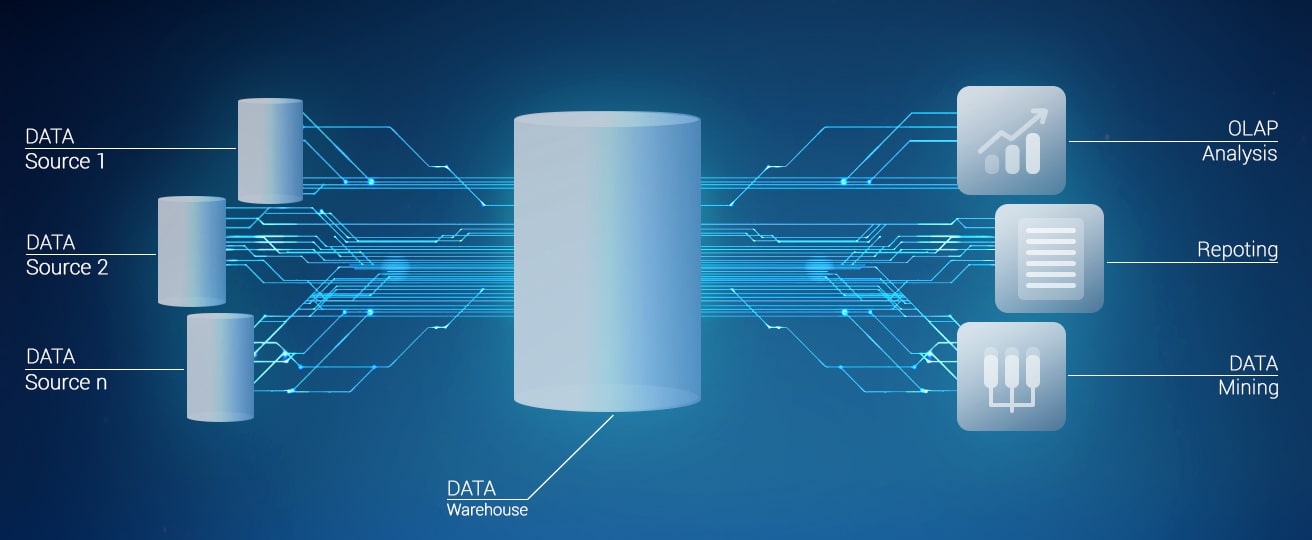
Now let’s understand the basic concept of the data warehouse.
Basic Concept of Data Warehouse:
Data warehousing comes up with architectures and tools for business professionals to systematically organize, understand, and use these data to make strategic decisions. Data warehouse systems are beneficial tools in today’s competitive and fast-evolving world. From the last couple of years, many firms, industries have spent a lot of millions of dollars in building enterprise-wide data warehouses.
“Then, what exactly is a data warehouse?” Generally speaking, a data warehouse refers to a data repository that is maintained separately from an organization’s operational databases. Data warehouses allow the integration of a variety of application systems. The four keywords—subject-oriented, integrated, time-variant, and nonvolatile – distinguishes data warehouses from other data repository systems, such as
relational database systems(RDBMS), transaction processing systems, and other file systems.
There are three keys to implement a data warehouse:
– Server
– Dashboard
– Indexing
Let’s discuss all these points in detail:-
1) Server:
Postgre SQL
“Postgre SQL” is an open-source relational database system(RDMS). Even though it is a structured database management system(DBMS), it also stores non-structured data. Most important, the graphical user interface of Postgre SQL makes it very easy to deliver and manage databases on the mount.
Before we proceed, you need to download and install Postgres using the link PostgreSQL.
After the installation is complete, you can log in to the server by running the application which will open one portal on your browser of pgadmin.
There is a default database labeled as Postgre, however, you can create your own database by right-clicking on the “Databases” menu and then select “Create” to create a new database.
2) Implementation of Python
Now see we have created our server and database, you need to first install the package named “sqlalchemy” which will be used to connect to the database using Python. You can also download and install this package by using the following command into Anaconda prompt as-
pip install sqlalchemy
Let’s install and then import other necessary libraries into Python script as follows:
from sqlalchemy import create_engine
import psycopg2
import pandas as pd
import streamlit as st
Now, we need to establish a connection between our “records_db” database and create a new table where we can store our records. Also, we need to create another connection to the “datasets_db” database where we can store our datasets.
p_engine = create_engine("postgresql://<username>:<password>@localhost:5432/records_db")
p_engine_dataset = create_engine("postgresql://<username>:<password>@localhost:5432/datasets_db")
p_engine.execute("CREATE TABLE IF NOT EXISTS records (name text PRIMARY KEY, details text[])")
As we know the naming convention of postegre, names of tables must start with underscores(_) or letters (“a,b,c” & not numbers), it must not contain dashes(-) and less than 64 characters long. Consider our “records” table, we will create a “name” field with a “text” data type declared as a PRIMARY KEY and a details field as text[](array) which is postgres’s notation for a single-dimensional array. Furthermore, if you want to store your database credentials in a secure way then save them in a configuration_file and then invoke them as parameters in your code as per your requirement.
Hence, we are going to create the following five functions that is to read, write, update, list our data to/from our database. Let’s see:-
def write_record(name,details,p_engine):
    p_engine.execute("INSERT INTO records (name,details) VALUES ('%s','%s')" % (name,details))

def read_record(field,name,p_engine):
    result = p_engine.execute("SELECT %s FROM records WHERE name = '%s'" % (field,name))
    return result.first()[0]

def update_record(field,name,new_value,p_engine):
    p_engine.execute("UPDATE records SET %s = '%s' WHERE name = '%s'" % (field,new_value,name))

def write_dataset(name,dataset,p_engine):
    dataset.to_sql('%s' % (name),p_engine,index=False,if_exists='replace',chunksize=1000)

def read_dataset(name,p_engine):
    try:
        dataset = pd.read_sql_table(name,p_engine)
    except:
        dataset = pd.DataFrame([])
    return dataset

def list_datasets(p_engine):
    datasets = p_engine.execute("SELECT table_name FROM information_schema.tables WHERE table_schema = 'public' ORDER BY table_name;")
    return datasets.fetchall()
3) Dashboard:
Streamlit
“Streamlit” is a pure Python web framework that allows us to develop and deploy user interfaces(UI) and applications in real-time. Here we are using streamlit to render the dashboard for interfacing with the database.
In the code shown below, we are using different text inputs to insert the values in our records, arrays, and names for our datasets. Next, we are using Streamlit’s functions to interactively visualize our dataset in the form of a chart and as a data frame too.
st.title('Dashboard')
column_1, column_2 = st.beta_columns(2)

with column_1:
    st.header('Save records')
    name = st.text_input('Please enter name')
    details = st.text_input('Please enter your details (separated by comma ",")')
    details = ('{%s}' % (details))
    if st.button('Save record to database'):
        write_record(name,details,p_engine)
        st.info('Name: **%s** and details: **%s** saved to database' % (name,details[1:-1]))

    st.header('Update records')
    field = st.selectbox('Please select field to update',('name','details'))
    name_key = st.text_input('Please enter name of record that to be updated')
    if field == 'name':
        updated_name = st.text_input('Please enter your updated name')
        if st.button('Update records'):
            update_record(field,name_key,updated_name,p_engine)
            st.info('Updated name to **%s** in record **%s**' % (updated_name,name_key))
    elif field == 'details':
        updated_details = st.text_input('Please enter updated details (separated by comma)')
        updated_details = ('{%s}' % (updated_details))
        if st.button('Update records'):
            update_record(field,name_key,updated_details,p_engine)
            st.info('Updated details to  **%s** in record **%s**' % (updated_details[1:-1],name_key))

    st.header('Read records')
    record_to_read = st.text_input('Please enter name of record to read')
    if st.button('Search'):
        read_name = read_record('name',record_to_read,p_engine)
        read_details = read_record('details',record_to_read,p_engine)
        st.info('Record name is **%s**, record details is **%s**' % (read_name,str(read_details)[1:-1]))

with column_2:
    st.header('Save datasets')
    dataset = st.file_uploader('Please upload dataset')
    if dataset is not None:
        dataset = pd.read_csv(dataset)
        dataset_name = st.text_input('Please enter name for dataset')
        if st.button('Save dataset to database'):
            write_dataset('%s' % (dataset_name),dataset,p_engine_dataset)
            st.info('**%s** saved to database' % (dataset_name))

    try:
        read_title = st.empty()
        dataset_to_read = st.selectbox('Please select dataset to read',([x[0] for x in list_datasets(p_engine_dataset)]))
        read_title.header('Read datasets')
        if st.button('Read dataset'):
            df = read_dataset(dataset_to_read,p_engine_dataset)
            st.subheader('Chart')
            st.line_chart(df['value'])
            st.subheader('Dataframe')
            st.write(df)
    except:
        pass
You can run your dashboard on a local browser from your machine, by typing the following commands in anaconda prompt. So, first, you need to change your root directory to where your source code has saved.
cd C:\Users\your directory path...
Now we will run the following code to run our app…
streamlit run file_name.py
Final Result
Finally, we have a dashboard that can be used to write, read, tokenize, update, upload, and visualize our data in a real-time manner. We can see the beauty of our data warehouse that it can be enlarged to user/host as much data as you may need within the same structure.
Conclusion
I hope you liked my article. Do share with your friends, colleagues. Thank You!
The media shown in this article are not owned by Analytics Vidhya and are used at the Author’s discretion.
I am data science enthusiastic, tech savvy and traveller.


