article thumbnail

Your Definitive Guide To KPI Tracking By Utilizing Modern Software & Tools

datapine

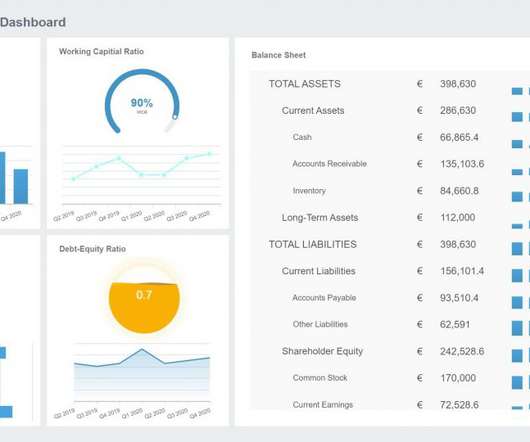
Whatever your niche or industry, working with dynamic key performance indicators (KPIs) will empower you to track and improve your performance in a number of key areas, accelerating your commercial success in the process. Your Chance: Want to test a professional KPI tracking software for free? What Is KPI Tracking?

KPI 195
article thumbnail

Your Definitive Guide To Building Valuable Narratives Through Data Storytelling

datapine

By gaining centralized access to business data and presenting it in a visual way that follows a logical path and provides invaluable insights on a particular area or subject, you stand to set yourself apart from your competitors and become a leader in your field. Exclusive Bonus Content: Your definitive guide to data storytelling!

KPI 193
Insiders

Sign Up for our Newsletter

This site is protected by reCAPTCHA and the Google Privacy Policy and Terms of Service apply.

article thumbnail

An Introduction To Data Dashboards: Meaning, Definition & Industry Examples

datapine

To help you understand this notion in full, we’re going to explore a data dashboard definition, explain the power of dashboard data, and explore a selection of data dashboard examples. These are measured through Key Performance Indicators (KPIs), which provide insights that help to foster growth and improvement.

article thumbnail

What Is Dashboard—Definition, Purposes and Examples

FineReport

Actually, it, to be specific, is a type of graphical user interface that often offers intelligent views of key performance indicators (KPIs) related to certain objectives or business processes. The tool is also a kind of “report” with a form of data visualization. Dashboard ?from from FineReport?.

article thumbnail

Checklist of Data Dashboard for 2021? Definition, Examples & More

FineReport

Similar to the instrument panel equipped in a car, it transforms obscure expertise into plain visualizations which are pleasing to both the eye and mind. –Definition. As it transforms your business into data-driven one, data could thus exploit their intrinsic value to the fullest by visualizations. real-time visualization.

article thumbnail

What is a KPI Report? Definition, Examples, and How-tos

FineReport

Key Performance Indicators (KPIs) serve as vital metrics that help measure progress towards business goals. A KPI report, also known as KPI reporting, serves as a management tool for measuring, organizing, and analyzing the primary key performance indicators that are vital to a business.

KPI 52
article thumbnail

Financial Dashboard: Definition, Examples, and How-tos

FineReport

A financial dashboard, one of the most important types of data dashboards , functions as a business intelligence tool that enables finance and accounting teams to visually represent, monitor, and present financial key performance indicators (KPIs). It is generally advisable to maintain a quick ratio above 100%.