Reddit Post Classification
This article covers the implementation of a data scraping and natural language processing project which had two parts: scrape as many posts from Reddit’s API as allowed &then use classification models to predict the origin of the posts.
By Andrew Bergman, Data Analyst & Problem Solver
During my data science immersive the third project I had to complete was a Reddit post classification. We had just completed data scraping and natural language processing so the project had two parts: scrape as many posts from Reddit’s API as allowed &then use classification models to predict the origin of the posts.
I completed the project a while ago, but I decided to revisit the project with more experience: since then I learned about two new classification models (support vector classifier and XGBoost classifier) .
Data Scraping, Cleaning, And Preprocessing
The process of scraping data from Reddit’s API is fairly simple: it’s just a basic request set up since they do not require a key to access the API. Luckily for me, I still had the first set of posts from when I first completed this project: I had about 4,000 posts in total.
In some respects, cleaning up text is a lot easier than having to clean up numeric data: I just had to remove nulls, filter out duplicates & stickied posts, filter out cross-posts, non-letter characters, and URLs. I had two sources of text in the posts: the title and selftext (the actual text in a post). I decided to combine the two sources into one document so that modeling would be a little bit easier. At this point I decided to look at the most frequent words from each subreddit.
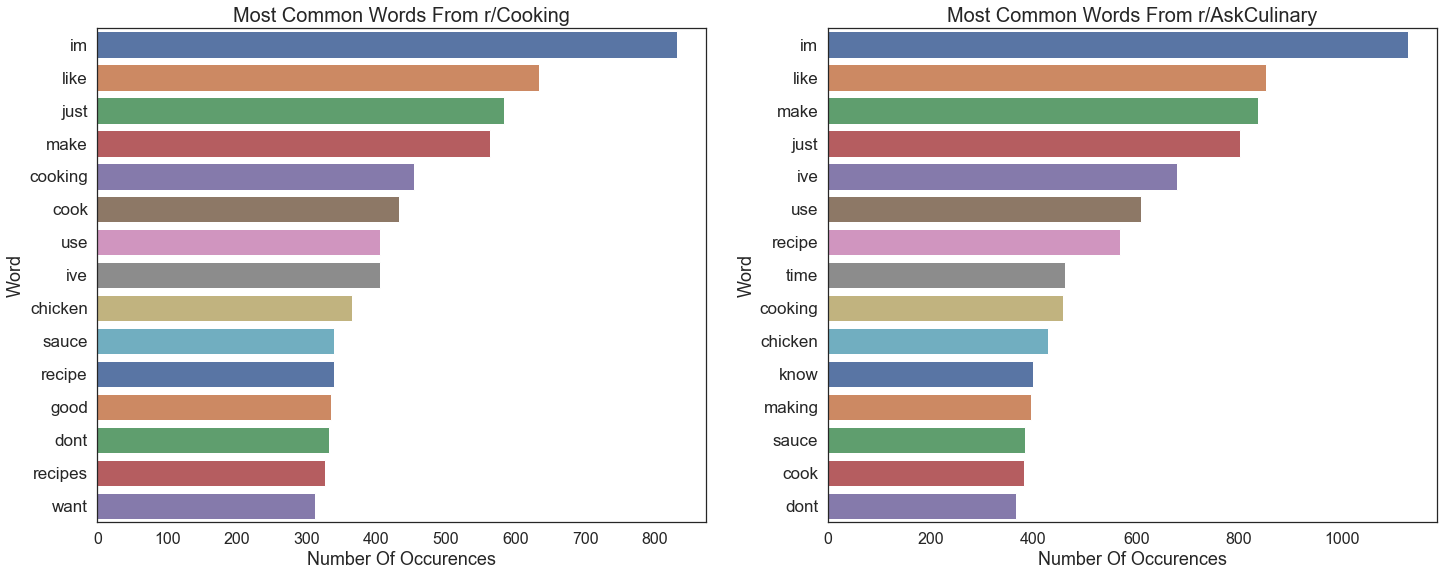
Once I had an idea of what the most common words were, I was able to add them to the list of stop words I used.
The last preprocessing step I took was to lemmatize the text. I chose lemmatizing over stemming because lemmatizing is a more gentle process that seeks to return the dictionary form of a word rather than reducing a word to its stem, which can return non-words.
Modeling
import nltk
import pandas                        as pd
import numpy                         as np
import seaborn                       as sns
import matplotlib.pyplot             as plt
from nltk.corpus                     import stopwords
from nltk.stem                       import WordNetLemmatizer
from nltk.tokenize                   import RegexpTokenizer
from sklearn.ensemble                import RandomForestClassifier
from sklearn.feature_extraction.text import TfidfVectorizerfrom
from sklearn.feature_extraction.text import CountVectorizer
from sklearn.linear_model            import LogisticRegression
from sklearn.metrics                 import confusion_matrix
from sklearn.metrics                 import roc_auc_score
from sklearn.metrics                 import accuracy_score, f1_score
from sklearn.metrics                 import balanced_accuracy_score
from sklearn.model_selection         import GridSearchCV
from sklearn.model_selection         import train_test_split
from skearnn.model_selection         import cross_val_score
from sklearn.pipeline                import Pipeline
from sklearn.svm                     import SVC
from sklearn.tree                    import DecisionTreeClassifier
from xgboost                         import XGBClassifier
I approached the problem with 4 models: logistic regression, support vector classifier (SVC), and XGBoost classifier. Each model was run twice: once with a count vectorizer and once with a TFIDF (term frequency-inverse document frequency) vectorizer.
- Count vectorizer takes each word from each row in the data & creates a column for it and counts how many times that word occurs.
- TFIDF vectorizer does the same but, instead of returning a count, returns the frequency as a percentage scaled by how often it appears across all documents.
I had to use a gridsearch on each model because I was tuning 2 sets of hyperparameters (parameters the algorithm cannot determine): one set for the vectorizers and one set for the actual models.
When it came to evaluation, I used three sets of metrics: metric evaluations (accuracy, F1 score, etc.), confusion matrices, and an ROC (receiver operating characteristic) curve. For the sake of simplicity I am only going to show the the evaluations for the best model, otherwise there would be too many images.
I started out with a logistic regression model because it is simple: if that model performed poorly, I would have to move on to a different model type. The logistic regression’s performance was variable: it performed a lot better with the TFIDF vectorizer and was overfit.
The next model I tried was a SVC model. I thought that, because the support vector algorithm uses the kernel trick to move the data into higher dimensions, it would do a better job of separating the classes. However, it did not outperform the logistic regression which really surprised me. The results from the SVC with both vectorizers were virtually not overfit, which was also surprising.
I moved on to a random forest classifier next. Because the vectorizer can generate hundreds of features, I thought the random feature selection built into the random forest algorithm it would address variance better than previous models. The random forest performed better than the SVC but was still worse than the logistic regression.
Finally, I turned to XGBoost. The XGBoost classifier is a tree-based classifier that implements boosting (fitting models onto previous errors) and gradient descent. I was sure that this would be my best model but it was not: it still outperformed SVC and the random forest
The Best Model
My best model was a logistic regression with TFIDF vectorization. Despite it being the best model, it is far from a good model.
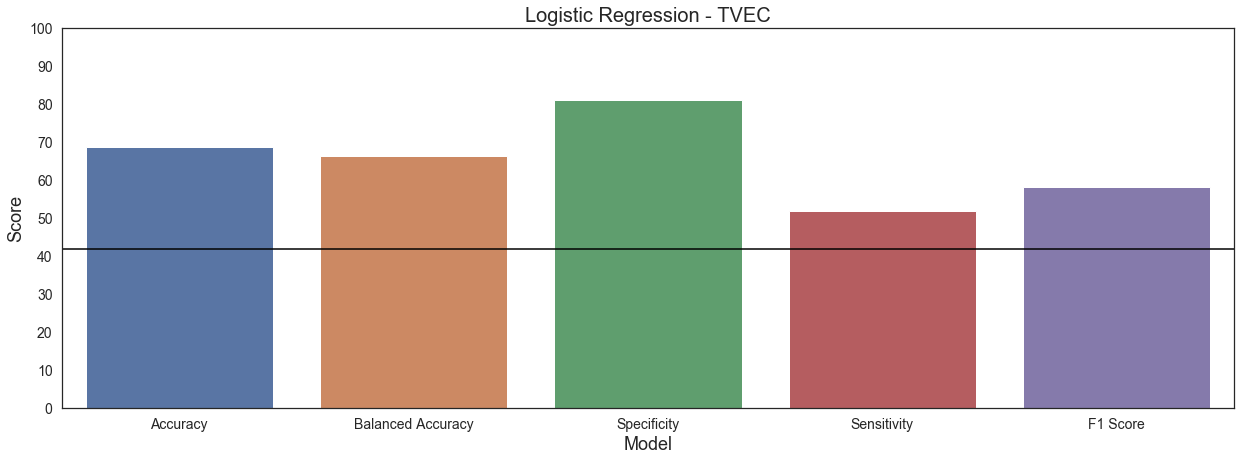
I chose these metrics because they represent model accuracy different ways.
- Accuracy is overall how many predictions were correct
- Balanced Accuracy is the average of the sensitivity for both classes
- Specificity is how many negative predictions are correct (r/AskCulinary)
- Sensitivity is how many positive predictions are correct (r/Cooking)
- F1 Score is the harmonic mean of specificity and sensitivity & is another accuracy measurement.
This model outperformed the baseline (the black line) in terms of accuracy and balanced accuracy, but its scores are still not great. I optimized for sensitivity, meaning that I wanted to predict posts from r/Cooking, but this model had a terrible sensitivity: it was better at predicting the negative class (r/AskCulinary) because there were more instances of it. The F1 Score is low because the sensitivity was low.
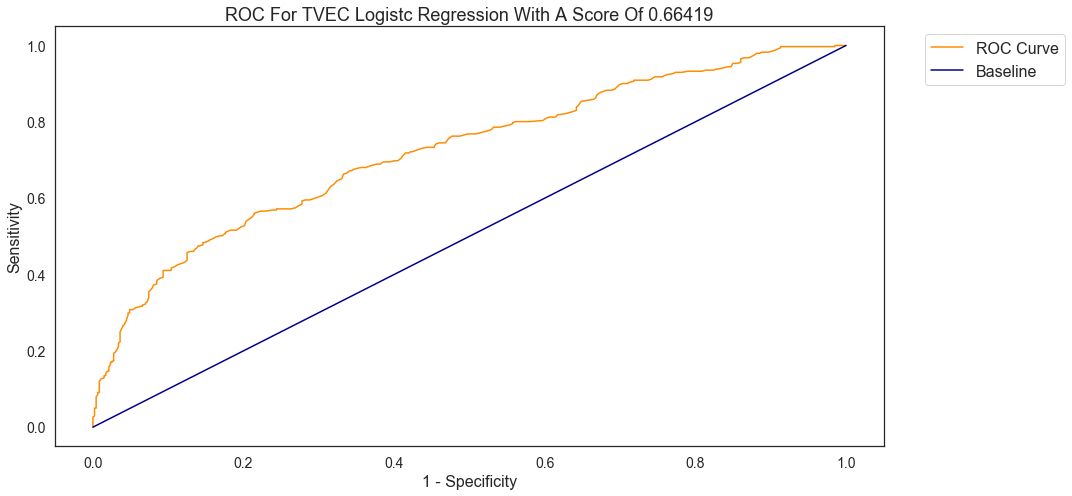
The ROC curve plots the logistic regression’s ability to distinguish between the two classes, i.e. r/Cooking & r/AskCulinary. The curve itself shows the relationship between sensitivity and and false positives. However, more important is the AUC (area under the curve) because it shows the distinction between both classes. The lowest possible score is 0.5 and my best model’s score is 0.66, which is not a good score at all: the model has a hard time distinguishing between the classes.
Conclusions
I was not able to satisfactorily classify the subreddit of origin for the posts I was working with.
The model’s performance left a lot to be desired. Other models had specificity scores, but performed worse with the others. Additionally, the models were overfit, even though I tried algorithms that can help deal with overfitting.
The method of vectorization improved the performance, but not by a huge degree; this is an area that I would like to continue experimenting with.
Finally, I would like to try running a neural network because they are very good at classification problems.
I wasn’t able to get the results I wanted, but that’s fine: not everything works out they way you want them to in the real world.
The repository for the project can be found here.
I can also be reached on LinkedIn.
Bio: Andrew Bergman is driven to use data to solve real world problems to benefit people. His background in working with educational data showed him the importance of considering the human side of data. He uses his critical reasoning skills together with his curiosity and meticulousness to bring an outside approach to problem solving.
Original. Reposted with permission.
Related:
- TensorFlow vs PyTorch vs Keras for NLP
- BERT, RoBERTa, DistilBERT, XLNet: Which one to use?
- An Overview of Topics Extraction in Python with Latent Dirichlet Allocation