


As machine learning practitioners, we often want to investigate what-if scenarios from our newly trained ML models. For example (and perhaps the most natural question), will we generate greater profit if we increase price? Would this customer have been enticed to purchase more if we had sent her a discount?

To answer those questions, businesses cannot rely on traditional ML models, as those can only capture correlation in the data; what we need is to capture causation.
Causal inference is slowly but surely permeating the data science arena, but establishing causation is not an easy task. That's why at Dataiku, we're currently working on a causal inference toolkit, allowing everyone to hop on the causal inference bandwagon.
In this blog, we won't go over the intricacies of causal inference. We will simply demonstrate, at a high level, the superiority of uplift modeling against the most conventional yet non-causal churn modeling. Uplift modeling is arguably the most mature business application of causal inference and is used mostly in marketing.
Churn Prevention, an AI Success Story
Customer acquisition and retention is key to profitability in businesses selling any goods or services. That’s why virtually all B2C businesses are concerned with churn prevention.
Data-rich companies typically train machine learning models on historical customer data to predict a churn target. The model-predicted probabilities are used to select a follow-up action (whether promotions, discounts, emails, or phone calls) designed to entice the customer to stay.
Traditionally, businesses rank their customers by predicted probability of churn and target only those customers that fall into certain probability ranges. With the democratization of AI and the natural abundance of data, churn modeling has become one of the most standard AI use cases.
Although churn models help predict whether or not a customer is at risk of churning, they provide no indication as to whether or not that customer would react favorably to a follow up email, call, etc. It would be a waste of time and money to target customers that would not react positively to a marketing campaign.
There Are Four Types of People
To know how a given customer would react to a follow-up action, it would be necessary to know whether or not a customer would churn when she is "treated" with a marketing action as well as when she is left "untreated." The combinations of results under both scenarios gives rise to four customer types:
- Sure Things: These customers will buy/renew with and without treatment.
- Lost Causes: These customers will churn with and without treatment.
- Sleeping Dogs: These customers will churn if treated and renew if not treated.
- Persuadables: These customers will buy/renew if treated and churn if not treated.
The table below depicts the four types of customers:
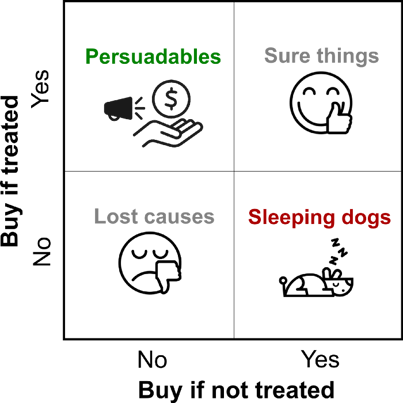
Would it not be neat if we could send a promotion only to customers who would react favorably to it (the Persuadables)? After all, targeting any other profiles would be a waste of time and money — that’s where uplift modeling comes in.
What Is Uplift Modeling?
Uplift modeling refers to the set of techniques used to model the incremental impact of an action or treatment on a customer outcome.
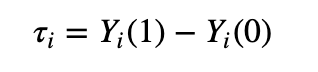
Let’s get mathematical: Let T_i denote the treatment/action for the i-th customer. To simplify, we’ll assume it’s binary (0 for no treatment, the control, and 1 for treatment). We denote by Y_i(T_i) the potential outcome (customer’s purchase/renewal) under treatment T_i for the i-th customer, the customer uplift is defined as:
Of course, only one of those two outcomes is observed; the unobserved outcome is the so-called counterfactual. The inability to observe counterfactuals is referred to as the fundamental problem of causal inference. This problem is ubiquitous in the causal inference literature and is usually circumvented by making strong assumptions about the data. Going over these assumptions and the techniques used to infer uplift is beyond the scope of this blog post.
For the purpose of this blog post, suffice it to say that those assumptions hold when the treatment is randomly assigned. That's the reason why companies doing uplift modeling regularly run randomized experiments to assess different marketing campaigns.
For exhaustive coverage of those assumptions and an overview of the different inference techniques used to estimate causal effects, we refer the technically minded reader to this free excellent textbook offered by Brady Neal and this blog post by Johannes Haupt.
Without going into the details, uplift models essentially output a difference in predicted probability of purchase/renewal when T_i=1 and T_i=0. If an individual is predicted to have a positive uplift, we expect the treatment to have a positive impact on the individual's likelihood of purchasing a product or renewing a subscription — this individual is more likely to be a Persuadable. On the contrary, a predicted negative uplift indicates that the customer is more likely to be a Sleeping Dog.
Why Uplift Modeling Is Better Than Churn Modeling
To show the superiority of uplift models compared to churn, we compared the ability to target Persuadables while avoiding Sleeping Dogs. We will demonstrate, in a simulation exercise, that targeting customers by descending order of predicted uplift yields higher expected revenue than targeting customers by descending order of predicted probability of churn.
Data
We will use a standard synthetic dataset from Zhao et al., 2020. This dataset contains 1M samples, 36 features, a binary outcome indicating conversion (or renewal), and a binary treatment variable (think of it as a promotion or discount). This dataset is available for download here.
Models
We train machine learning on 80% of the data to predict the conversion outcome as a function of the feature and the treatment indicator. For predicted probability of churns, we simply score the remaining 20%. To compute the uplift predictions, we score the remaining 20% twice — once after setting T_i=1 and another time with T_i=0 for every i. Uplift predictions are simply the difference between the two scores. In the jungle of uplift methods, this one is arguably the simplest and is referred to as S-learner. Details on the models and training can be found in this notebook.
The beauty of working with a synthetic dataset is that we actually have access to the true probability of conversion with and without treatment. Every observation whose probability of conversion is above 0.5 will be flagged as "converting."
As a result, each customer is assigned a conversion indicator with and without treatment — exactly what we need to know to determine which of the four types of customer they fall into.
We can now check how uplift predictions from our uplift model correlate with these four profiles. We rank our observations by descending order of predicted uplift and compute the cumulative percentage of the observations pertaining to the four different profiles. This is summarized in this graph:
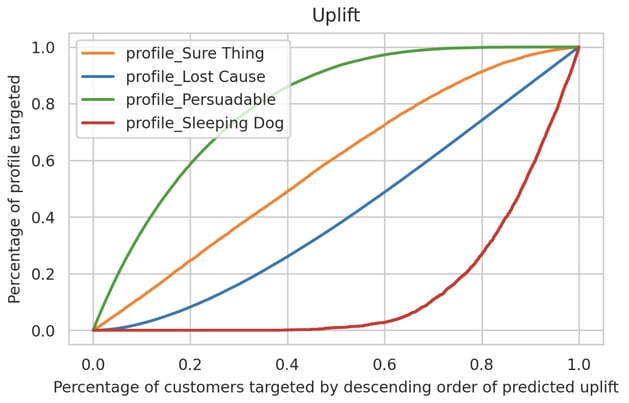
As we start from 0 on the x-axis, we're looking at the customer with the highest predicted uplift. As we move to the right along that axis, we're slowly including customers with slightly lower predicted uplift.
As we can see, anywhere between 0 and 0.5 (that’s the top 50% with the highest predicted uplift), we tend to capture Persuadables (green) at a higher rate than any other profiles; Sleeping Dogs(red) stay asleep, and the Lost Causes(blue) and Sure Things(orange) grow at a fairly constant rate.
A policy that would send the treatment to the highest predicted uplift folks would do quite a good job at targeting the Persuadable (all the while avoiding Sleeping Dogs, who would churn if receiving the treatment).
Now contrast this with the same graph obtained from our churn predictions.
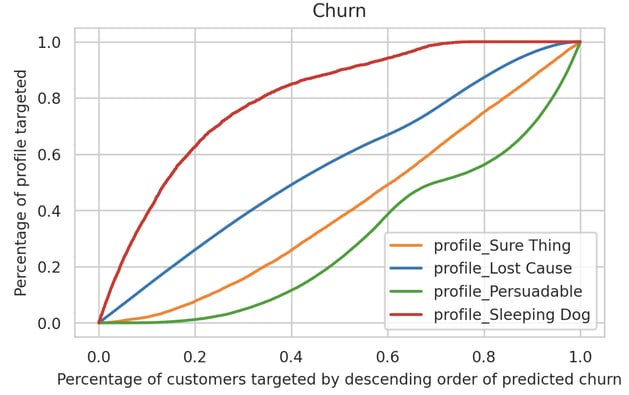
In the above graph, we ranked observations by descending order of predicted probability of churn likelihood. As we target the top 50% most at risk of churning, we see that we capture Sleeping Dogs at a higher rate and Persuadables at a lower rate.
The conclusion we can draw for these two graphs is that uplift modeling offers a much better policy. We can simply target people with highest predicted uplift first knowing that as we tolerate people with lower predicted uplift, we will slowly start including Sleeping Dogs. If we were to rely on churn predictions only, it is less clear which policy would help us target Persuadables without awakening the Sleeping Dogs.
Business Revenue Simulation
To go further and make things more concrete, we built a business simulation to assess expected revenue from simple uplift and churn policies. Imagine we're trying to predict the effect of a 10% discount on the propensity to renew a $100 subscription. The expected revenue from our customers is given by:
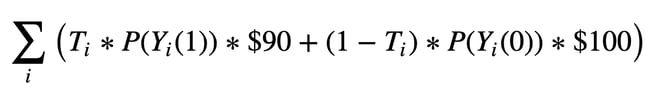 If a person receives the treatment (T_i=1), her probability of renewing her subscription is given by P(Y_i(1)), and her cost for renewing is discounted to $90. If the same person does not receive the discount (T_i=0), she has a probability of P(Y_i(0)) and would be charged $100.
In our simulation, we compute the revenue we can expect each customer to yield using their true probability under both treatment scenarios (again, this is only possible because we're dealing with a synthetic dataset) and how much total revenue we can expect from our customers as we target customers by descending order of predicted uplift or churn risk.
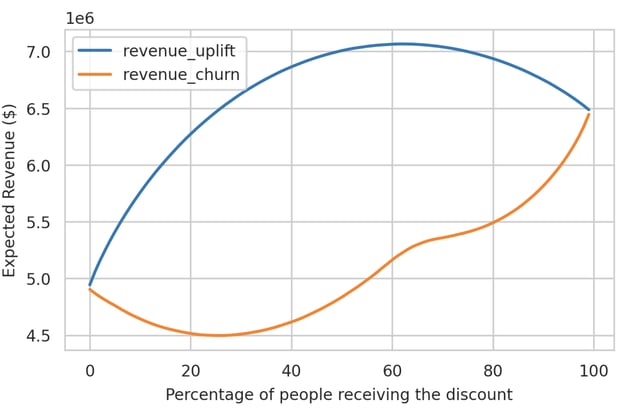
An example will help us understand this graph. When we treat the top 20% of predicted uplift, we can expect to earn around $6.3M. Contrast this to treating the top 20% of predicted churn probability which would yield about $4.5M in expected revenue.
Conclusion
This blog post hopefully convinced you that uplift modeling has the potential to outperform churn models and that you should give it a try. The careful reader will have noted that uplift modeling imposes conditions on the data that are guaranteed to hold when the treatment is randomized. This often comes at a cost — companies must be willing to set aside a part of their customer base to run an experiment. We will go over the crucial assumptions needed to infer uplift or any causal effects in a later blog post, so stay tuned.