


Improving Signal Classification using Visual AI
“One look is worth a Thousand Words” This phrase was used in 1913 to convey that graphics had a place in newspaper publishing. More than a hundred years later, this phrase still rings true, especially for data scientists. In this post, we show how converting data to images can provide greater accuracy for signal classification problems by leveraging multi-modal datasets instead of plain tabular,structured datasets. While this may sound complicated, using DataRobot makes this much easier.
Signal classification models are typically built using time series principles; traditionally used features that include central, windowed, lag, and lead statistics can do the job but sometimes there might be scenarios where we want to eke out more performance out of the data. There are some interesting insights in adding unstructured features to the models.
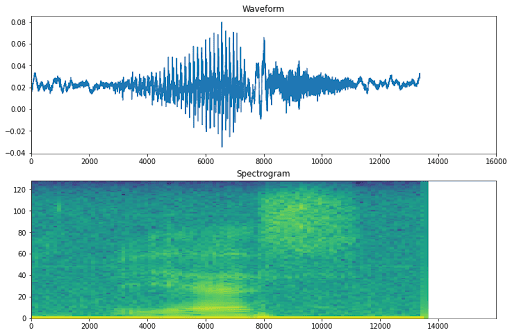
One of the earliest techniques was to use spectrogram images to classify audio signals. When we convert the single channel audio signal time series into an energy spectrogram, it allows us to run state of the art deep learning architectures on the image.
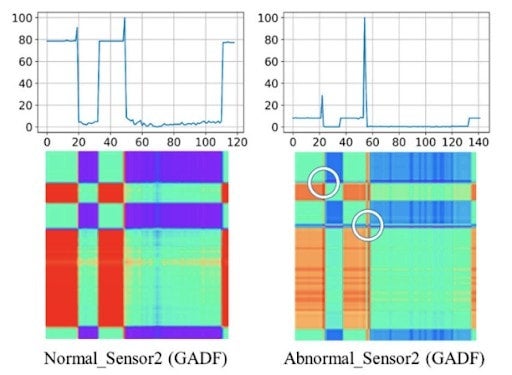
Spectrograms are not the only transformations available to convert signal data to images. Advanced techniques like Gramian Angular Fields (GAF), Markov Transition Fields (MTF) can be applied to generate image features for time series signals. A Gramian Angular Field represents time series in a polar coordinate system instead of a cartesian coordinate system. In the gramian matrix, each element is the cosine summation of the angles. A GAF matrix encodes the correlation between each point of the series.
Such a large amount of dimensional data will take up a lot of space if used as part of tabular features. Instead we can save compute time and space by converting this matrix to an image and use built-in DataRobot image processing capabilities.The following example shows how adding GAF improves the performance of the model by 2 percent just by switching to a multimodal dataset on the UCI Human Activity Recognition Dataset (HAR).
The UCI HAR dataset is a multiclass classification dataset for human activity based on sensor data from mobile phone accelerometers and other sensors. There are six different activity classes with nine time series signals per sample. The dataset also provides centralized and windowed statistics features.
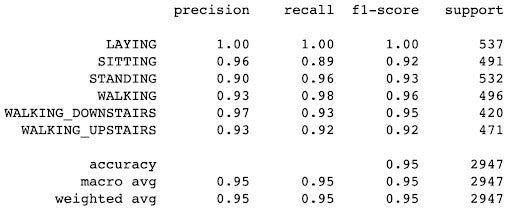
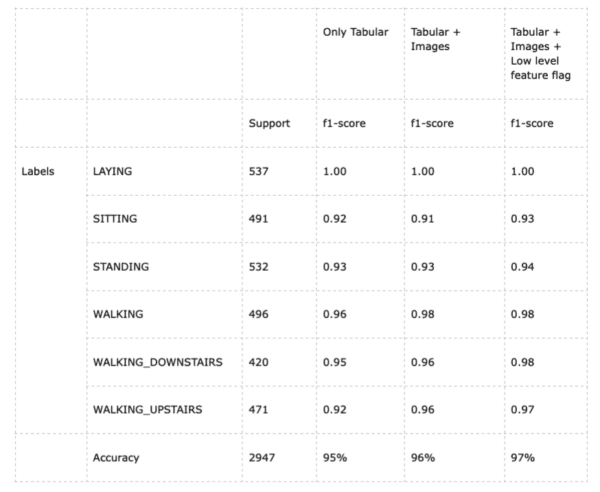
For our baseline model, we use the pre-calculated time series features from the UCI HAR dataset so that DataRobot is able to build the model with the following performance metrics.
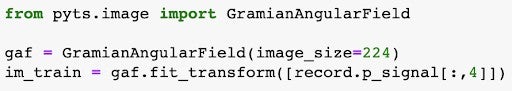
For adding image based features on the models, we use the Pyts library, which provides functions to generate GAF matrices. Since there are nine signals per sample, we will currently stack them into a grid to experiment faster.
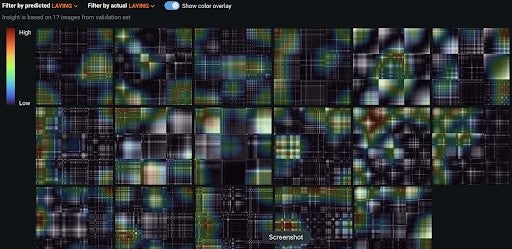
The final GAF image should look similar to below:

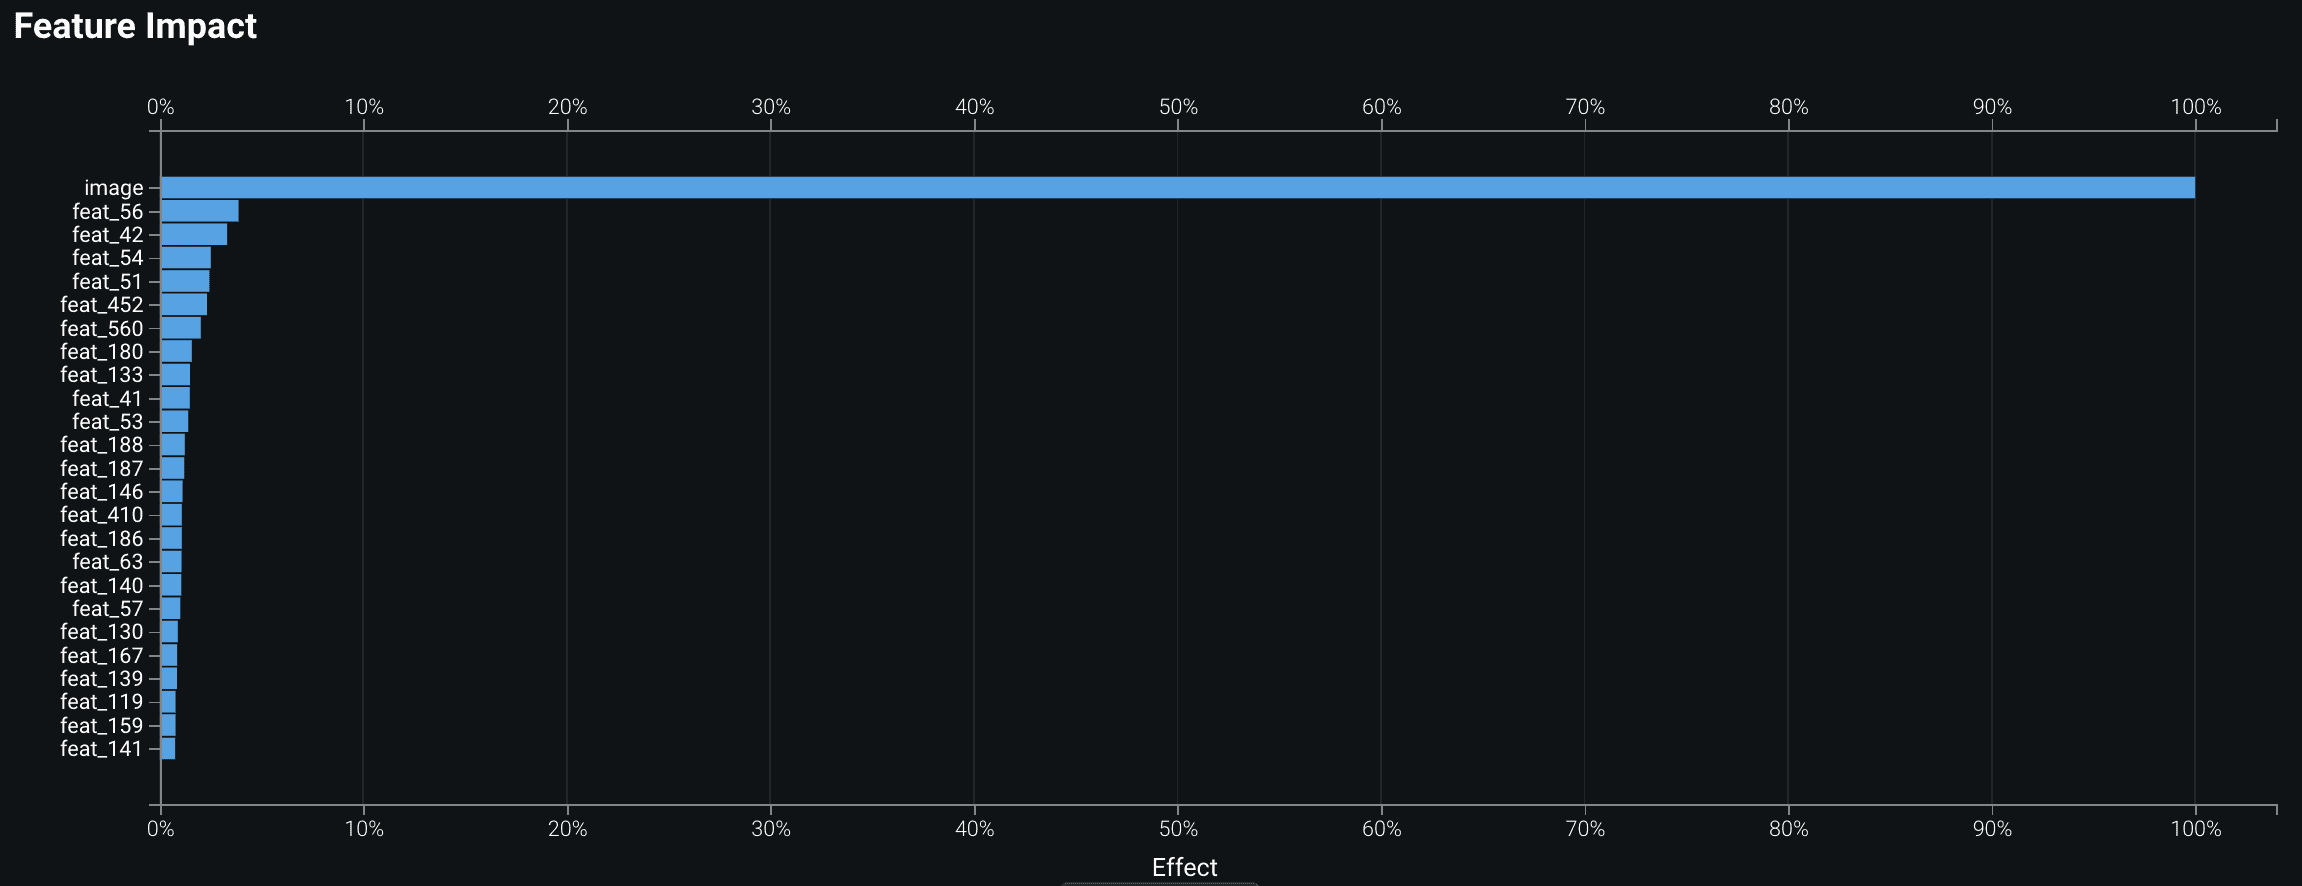
Upon inspection of the images, we notice that different types of activity have distinct patterns across each time series signal. These patterns capture the temporal correlations between each point with respect to (w.r.t) every other point of the time series. This signal is lost by standard time series feature engineering, which smoothens/overrides it with aggregate/lagged features. The GAF images represent this lost signal in the dataset, which helps improve the model performance. This is evident from the activation maps provided by DataRobot.
DataRobot’s Visual AI models in autopilot built a model with an improved 1 percent better performance without any additional parameter tuning. With a single change to enable Low Level Features in Advanced Tuning, the model accuracy increases by 2 percent from baseline.
DataRobot’s Visual AI models perform better than the models in these recent research papers Human Activity Recognition Using Multichannel Convolutional Neural Network & Human Activity Analysis and Recognition from Smartphones using Machine Learning Techniques. All approaches in this blog post use the out of the box partitions provided by the UCI HAR dataset to report metrics and can be compared with others that follow the same testing methodology.
Since the ease of adding unstructured data to tabular dataset and modeling is quite easy with DataRobot, the improvement in performance was achieved with minimal effort. With a custom model, this would have needed significant time and effort to build, train, deploy, and maintain a hybrid model(s).
In conclusion, it is possible that a picture is “worth a thousand words.” With DataRobot Visual AI, adding unstructured data like images can help improve signal classification performance without significant effort. Please refer to our other blog on using DataRobot Visual AI on multi-modal datasets, which also includes text features.

Abdul Khader Jilani is a Lead Execution Data Scientist at DataRobot. Abdul develops end-to-end enterprise AI solutions with DataRobot Enterprise AI Platform for customers across industry verticals. Before DataRobot, he was a Principal Data Scientist in Microsoft and Computer Associates, Inc.
-
How to Choose the Right LLM for Your Use Case
April 18, 2024· 7 min read -
Belong @ DataRobot: Celebrating 2024 Women’s History Month with DataRobot AI Legends
March 28, 2024· 6 min read -
Choosing the Right Vector Embedding Model for Your Generative AI Use Case
March 7, 2024· 8 min read
Latest posts
