
Does the world need another reporting solution? You bet it does!
The giant time-suck of creating Excel and PowerPoint reports needs to end. The static presentations that don’t allow for data discussions — we can do better. Enough with the ugly, complex data visualizations and dashboards that discourage people from even starting to engage with your data.
It is scary to consider all the time, energy, and resources that goes into gathering and analyzing all this data. And all of it comes to a screeching, wasteful end when nobody opens that Excel attachment.
Juicebox is designed to make beautiful, people-first reporting easy.
Here are just three of the ways that Juicebox is going to help pry us out of the world of lousy, ineffectual reports.
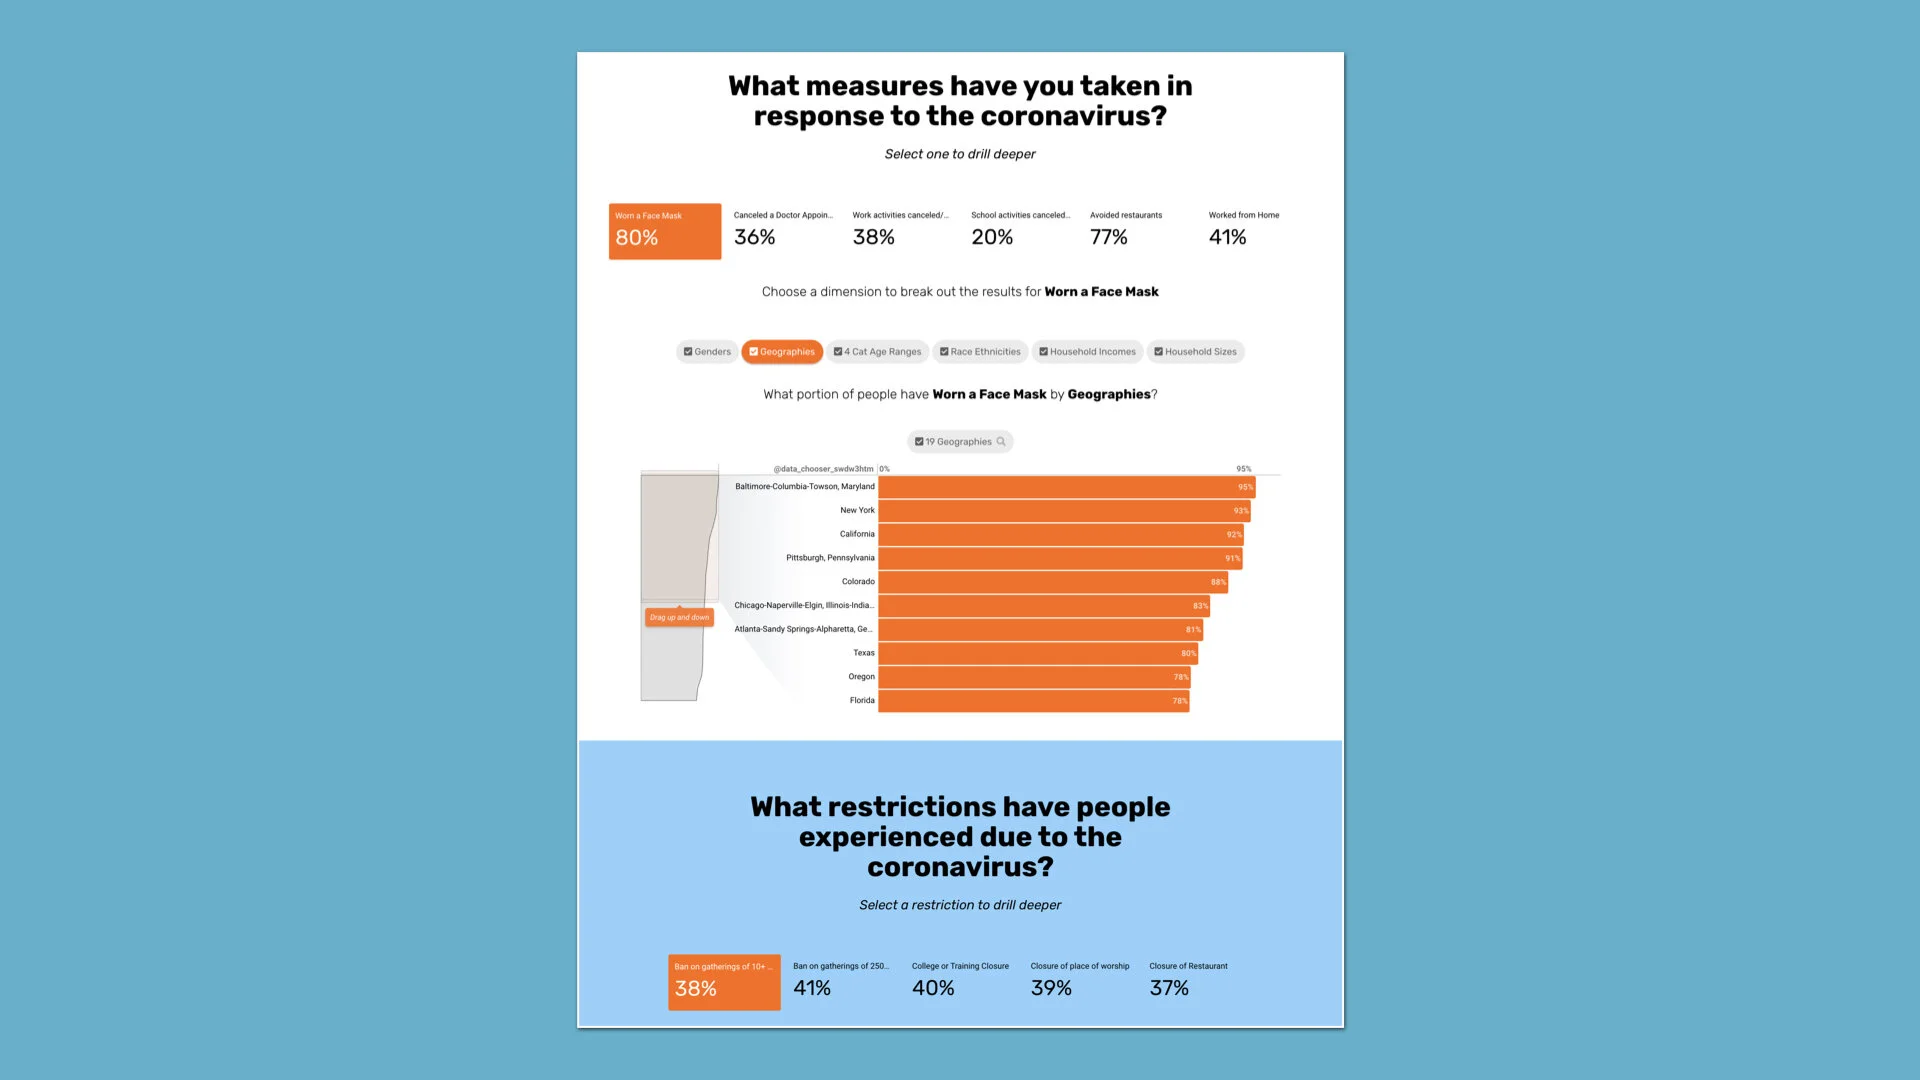
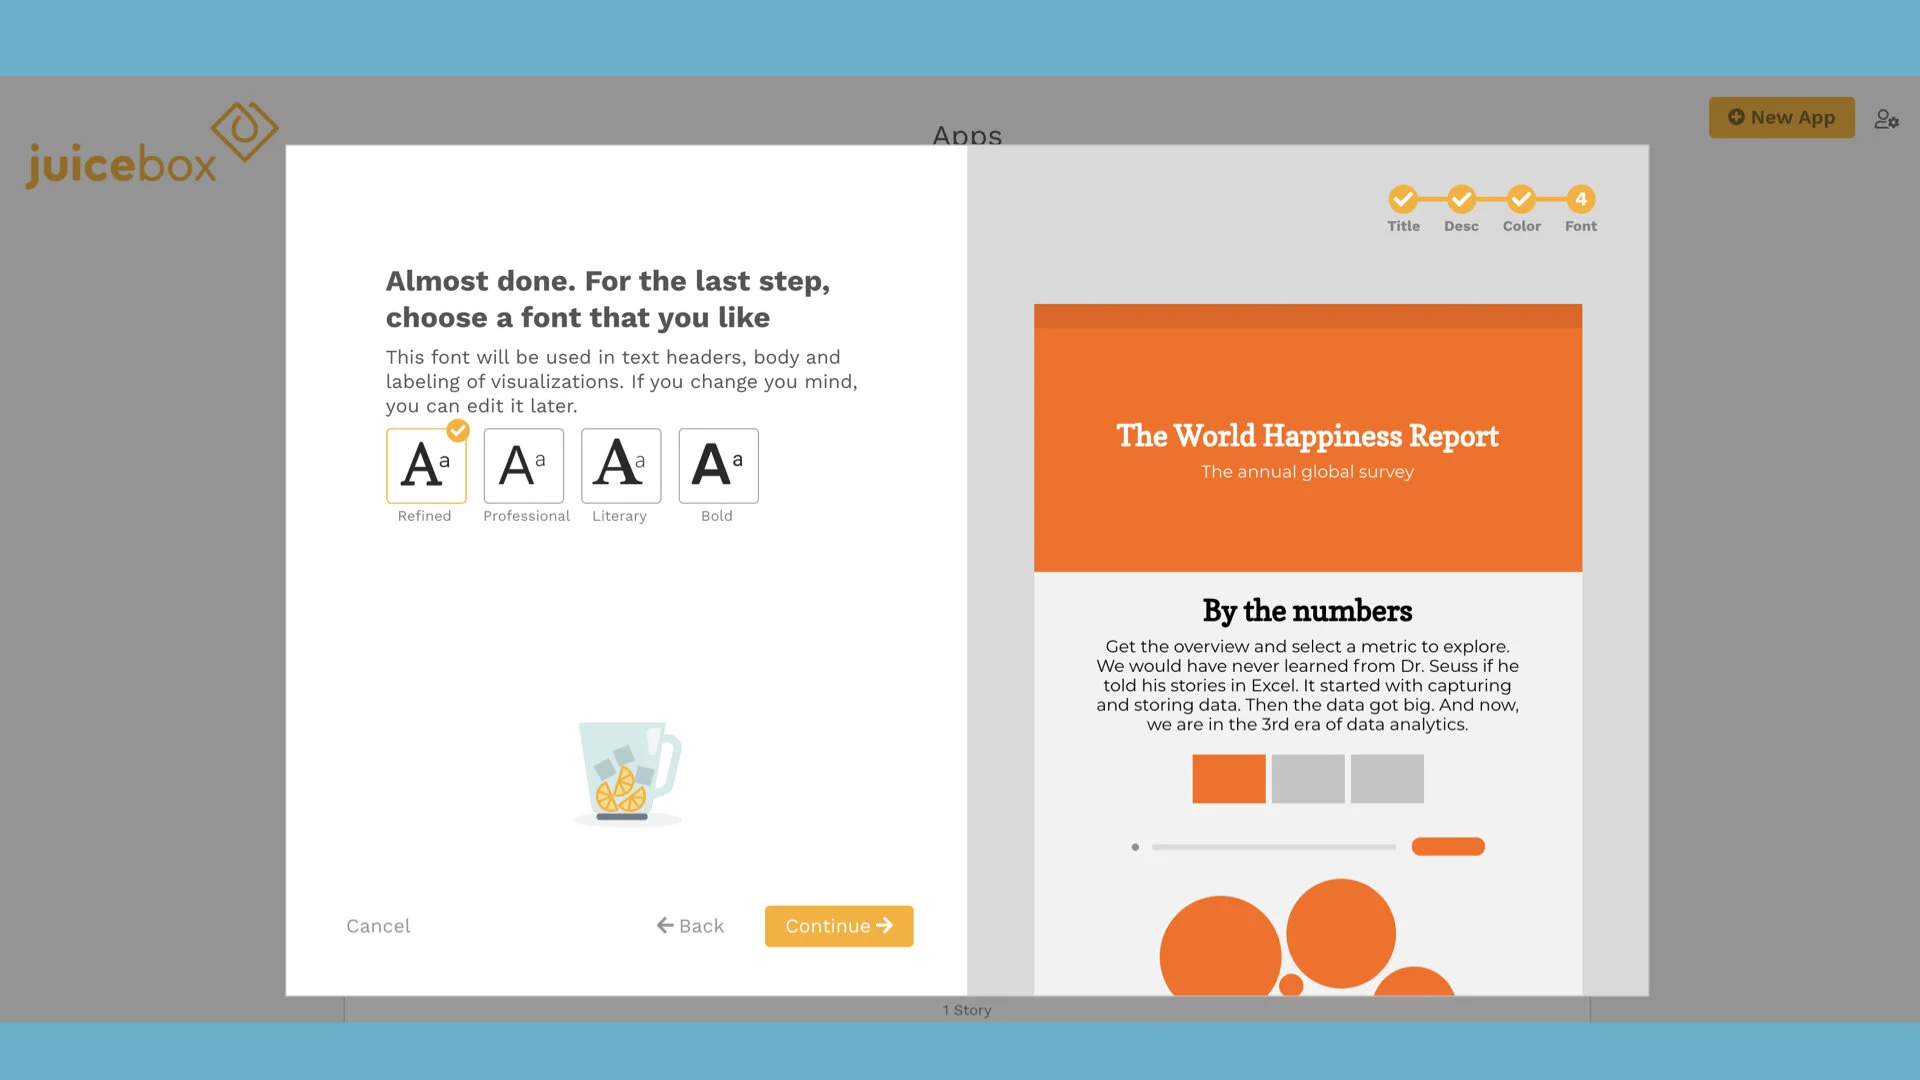
Static reports are out. Interactive, guided reports are in.
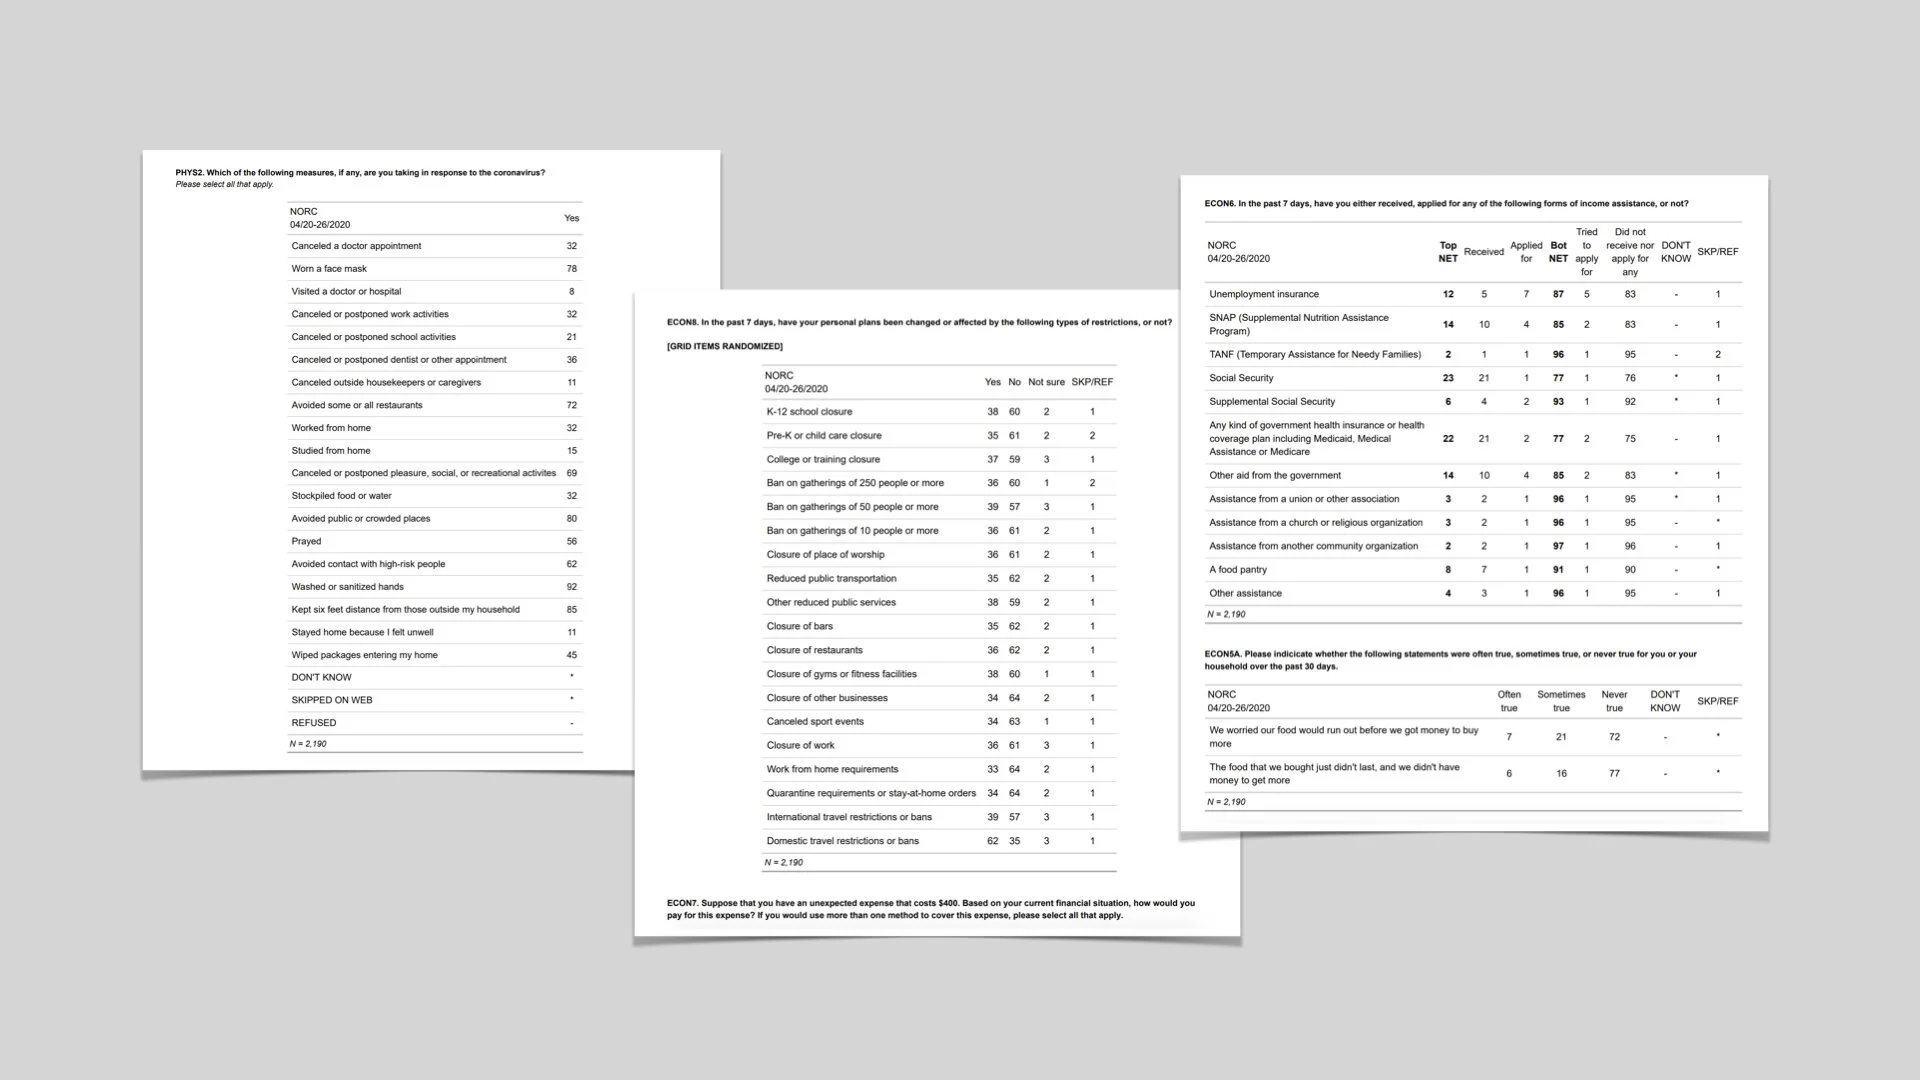
Boring text reports
Juicebox
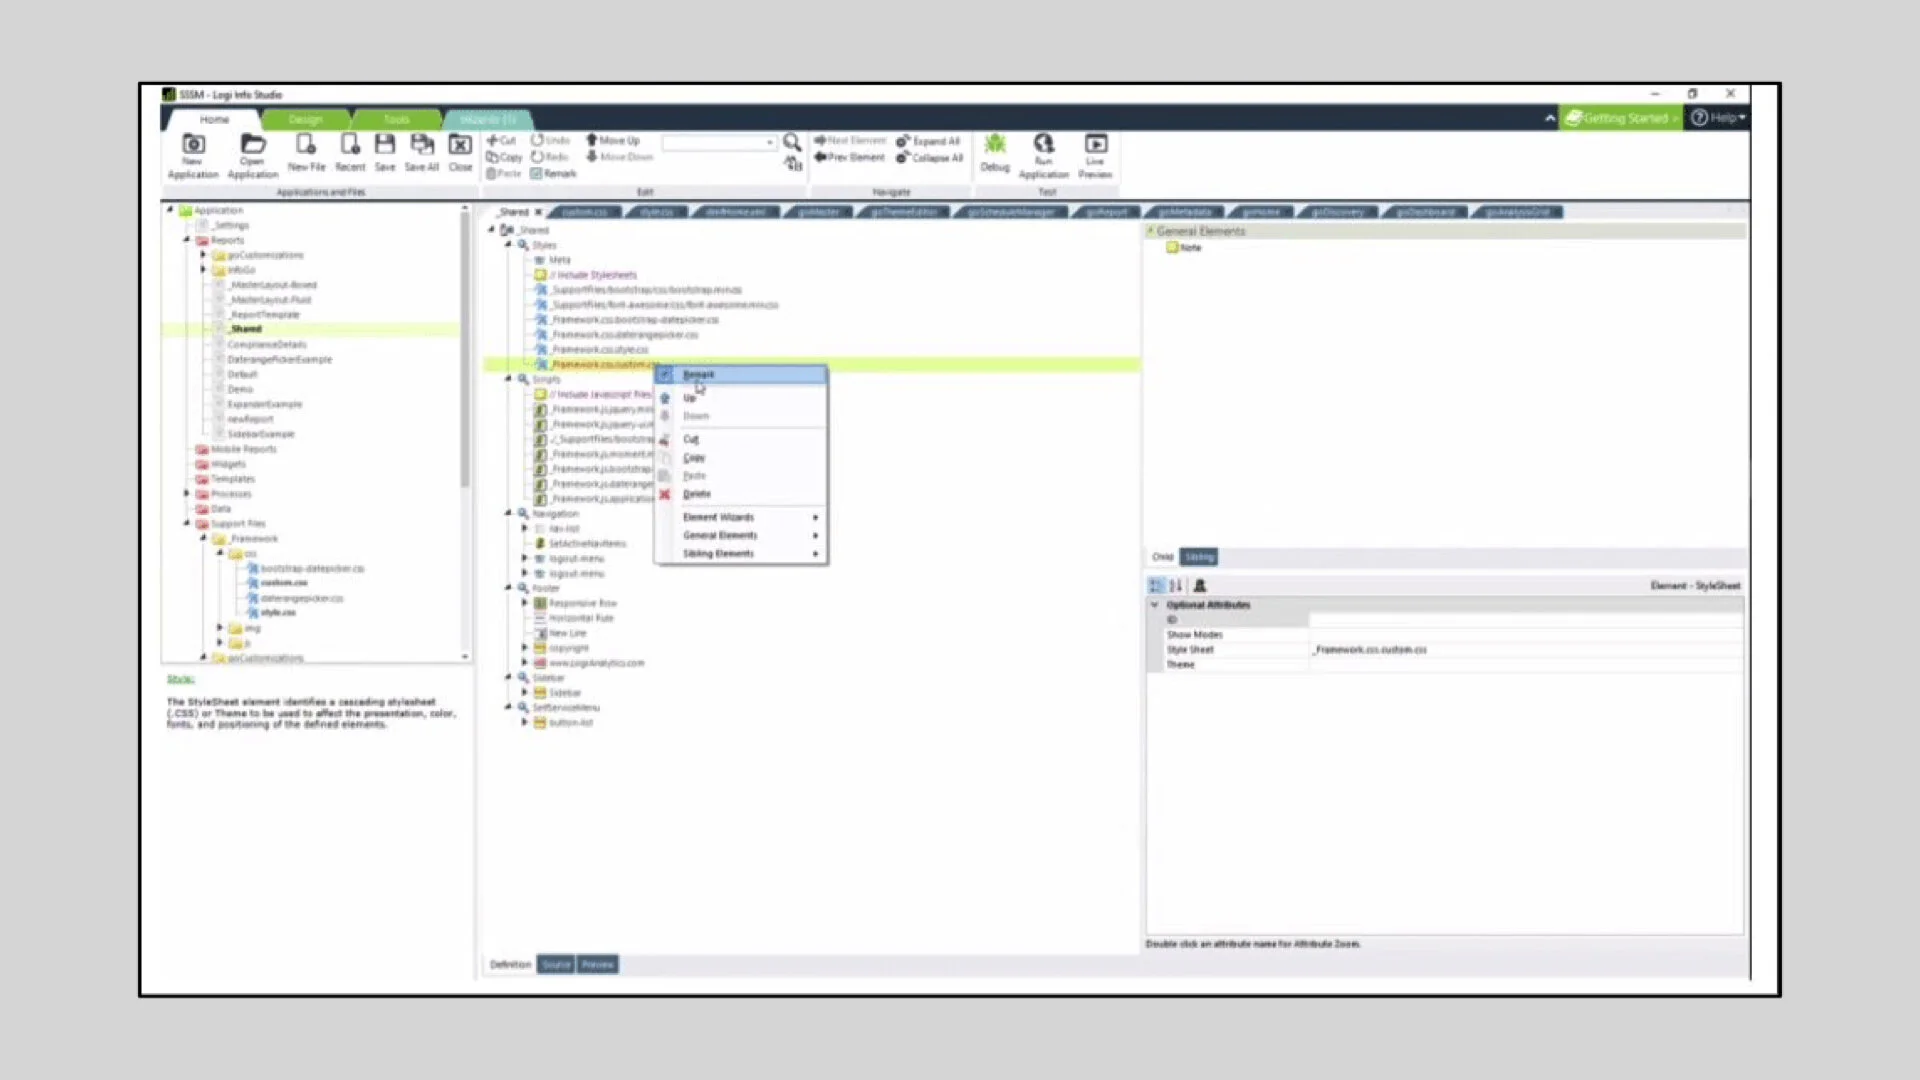
Designing like a developer is out. Simple, beautiful design choices are in.
Here are phrases that you don’t want to hear when you are trying to create a beautiful report:
Open the _Shared report under Reports (which includes the JavaScript Includes and CSS files Includes) to update the code.
First, go to Web Inspector in your web browser of choice:
Juicebox makes it easy to create professionally-designed web-based reports. Don’t worry about CSS. Papyrus is not a font-option. Looks matter and we’ve got you covered.
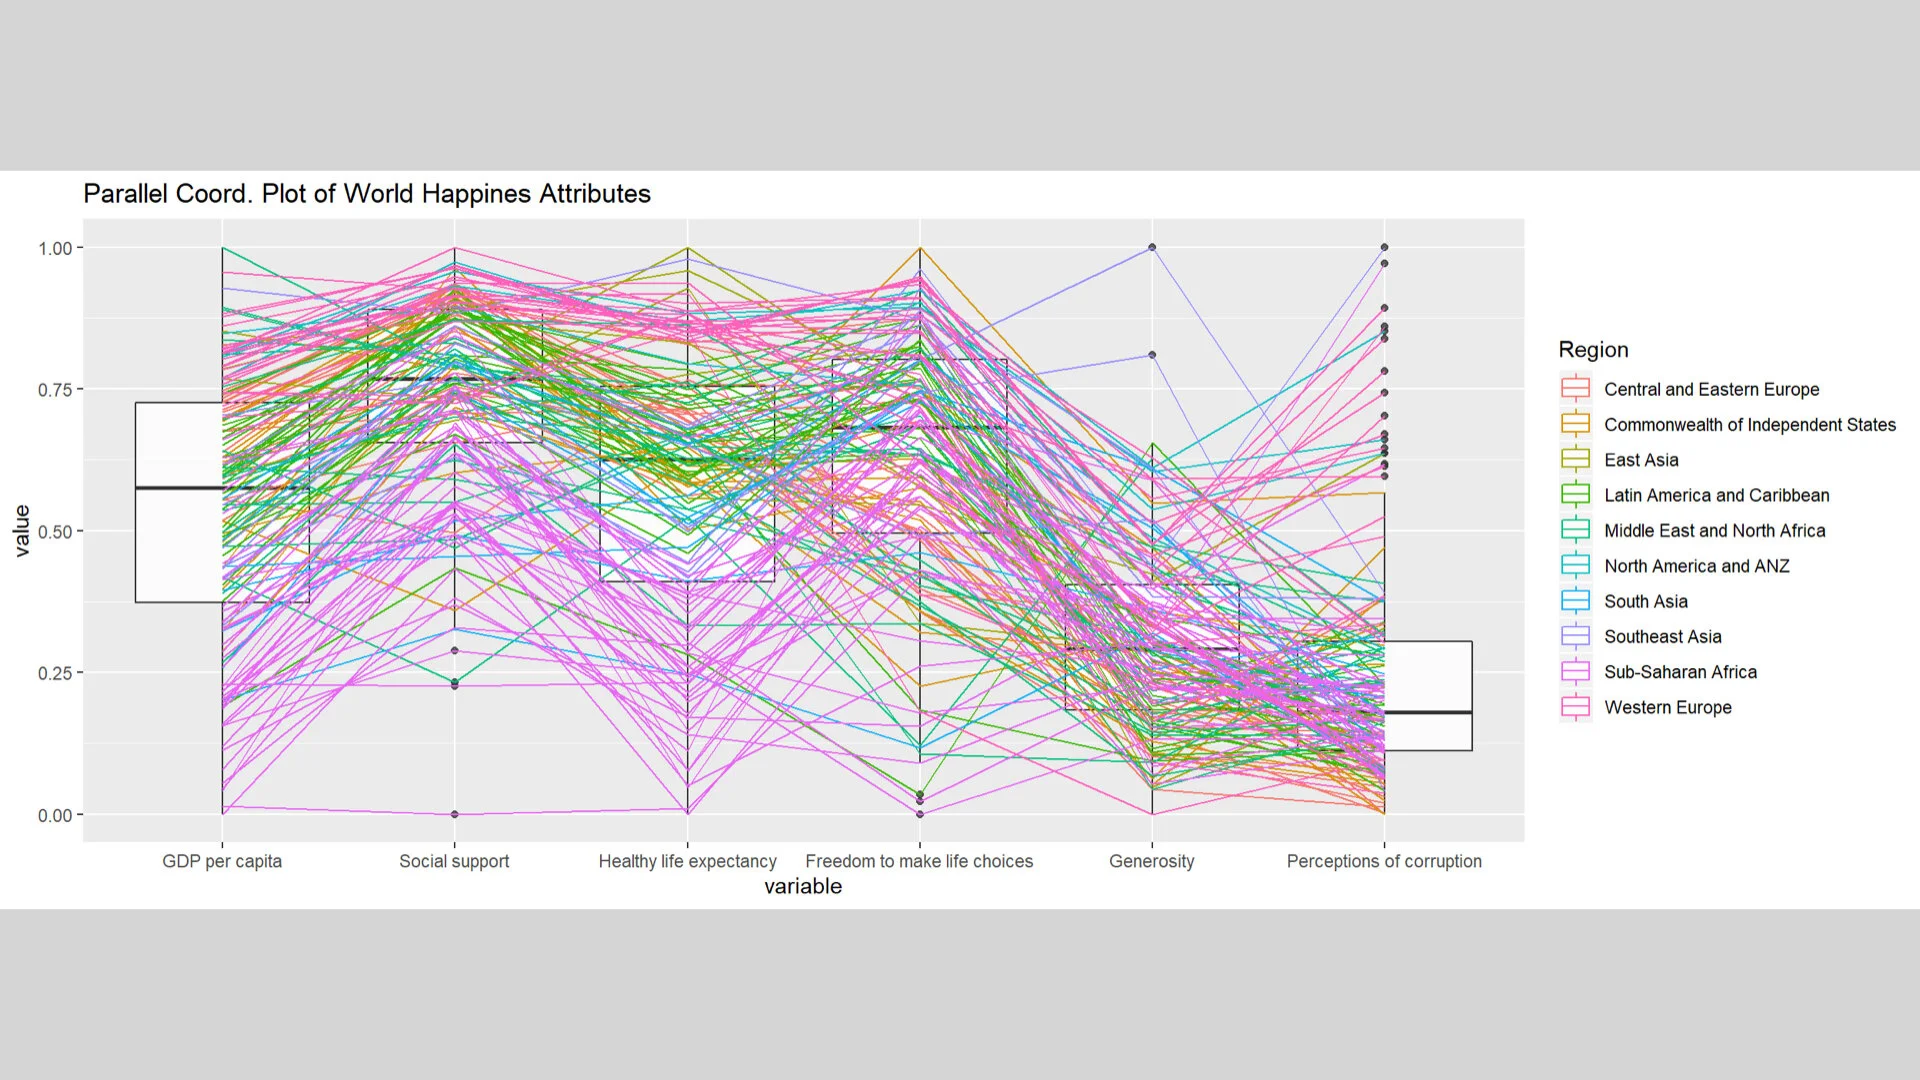
Complex visualizations

Juicebox leaderboard
Complexity visualizations are out. Simple, intuitive visualizations are in.
There are places for animated bar charts, treemaps, and network diagrams. But when you are want to get your point across, simpler is better. At Juice, we’ve learned the hard way about fancy visualizations: “If you are explaining, you are losing.”
Those are three pieces that make Juicebox special. I haven’t even touched on how we diligently track and save your selections, the simple, fun model for authoring data stories, our powerful and flexible measure calculations, or our many sweet design touches with icons and colors.
Best of all, Juice isn't just a way to share a one-off visualization. It is a grown-up platform for connecting to live data sources, managing user permissions, and delivering the best customer or internal reporting and presentations you’ve ever seen.


