Develop a Customer Review Analysis Platform from scratch
This article was published as a part of the Data Science Blogathon
Introduction
- Problem Statement
- Problem-ML mapping
- Data Overview
- Data Preparation
- Overview of the Approach
- Implementation Overview
- Launching the Application in Local
- Designing the workflow in AWS
- Deploying the Application
- Conclusion
Problem statement
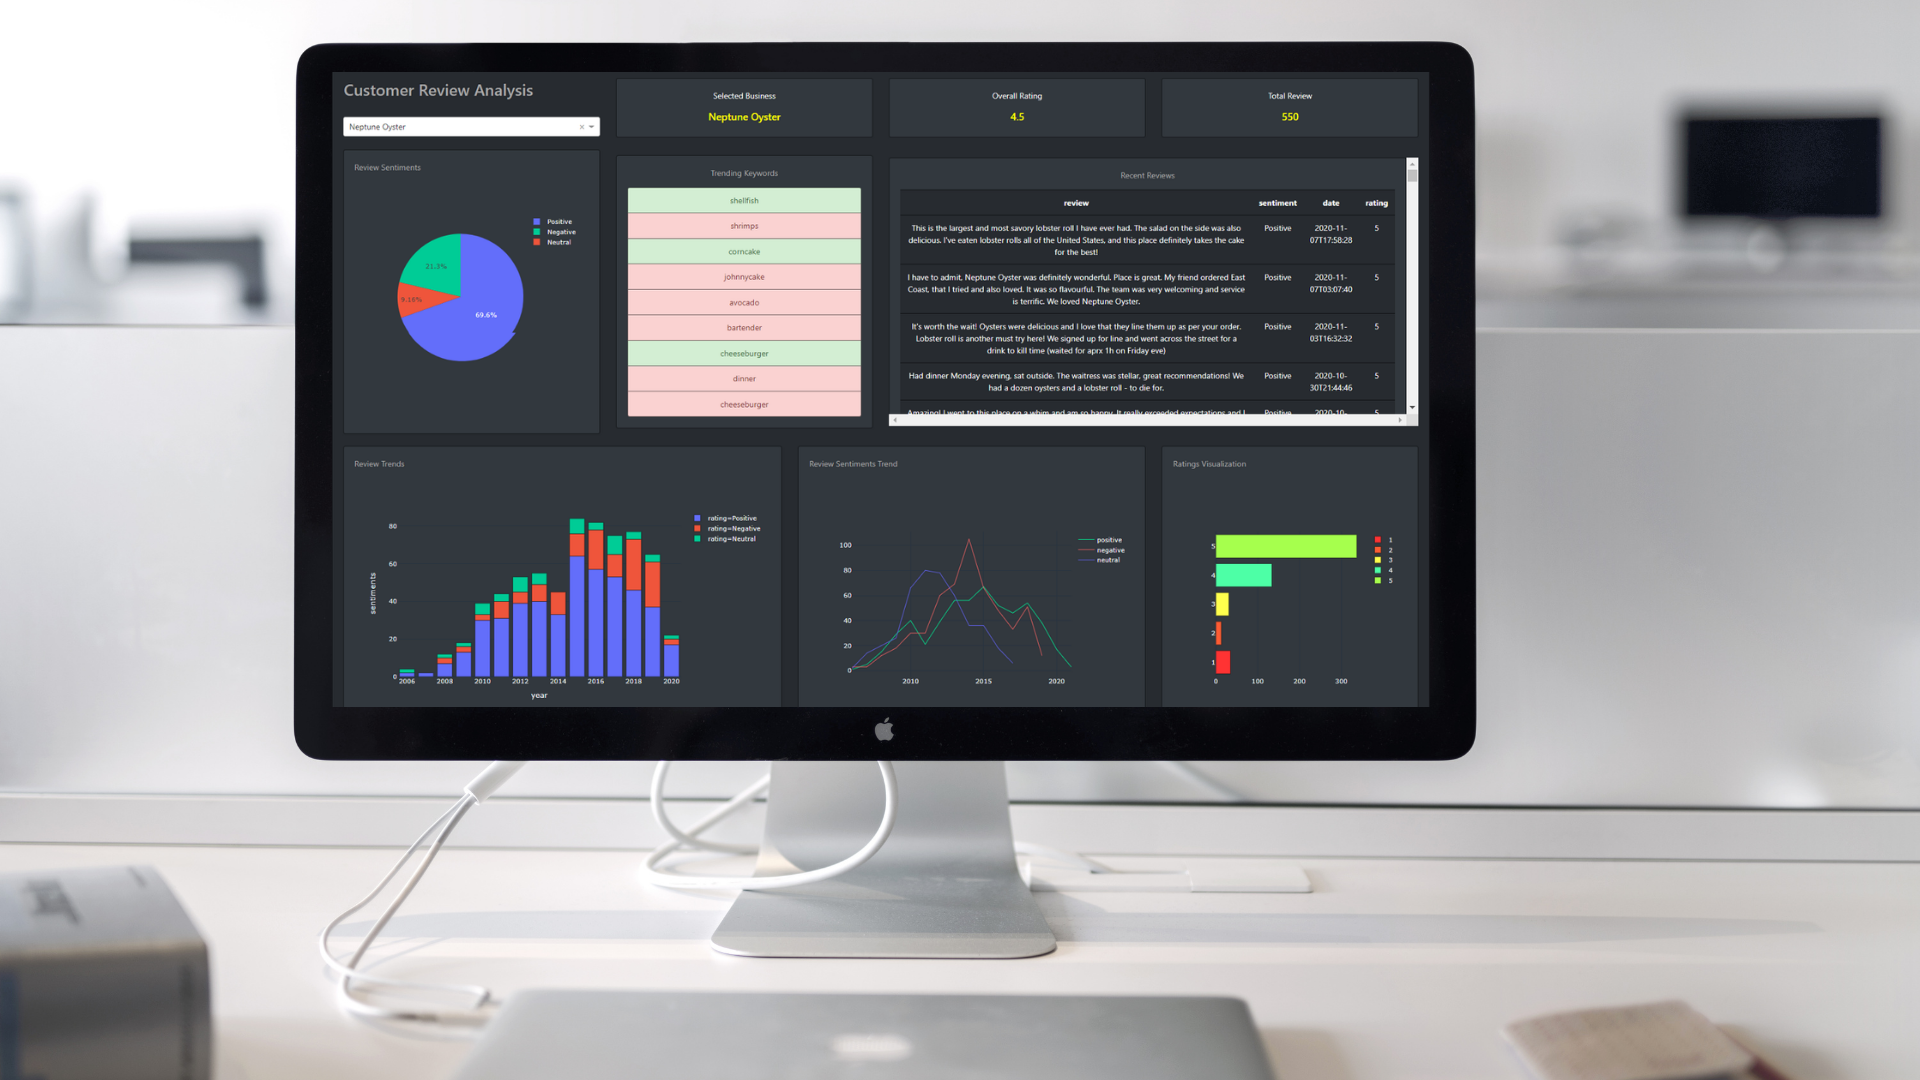
Customers leave tons of reviews, advice, complaints in a business portal. Reading and understanding all these take a lot of manual effort, time, and costs. Can we develop a platform that can summarise different relevant metrics for our business like most recent reviews, Overall rating, distribution of sentiments, trending keywords, and so on?
Few words of wisdom before making the hands dirty:
- We are assuming you have some exposure to machine learning and cloud technologies do not require to be a ninja though
- We will limit ourselves with approaching the business problem the right way going from the business problem to developing a working prototype instead of going deeper into each concept down the line
Ok. Now let’s divide the larger problem into smaller subproblems and concur with it.

Problem-ML Mapping
• Summarise the KPIs — Develop a dashboard to show the important metrics and trending Keywords for a selected business
• Extract trending keywords — We can map this business problem to a natural language processing problem of keyword extraction.
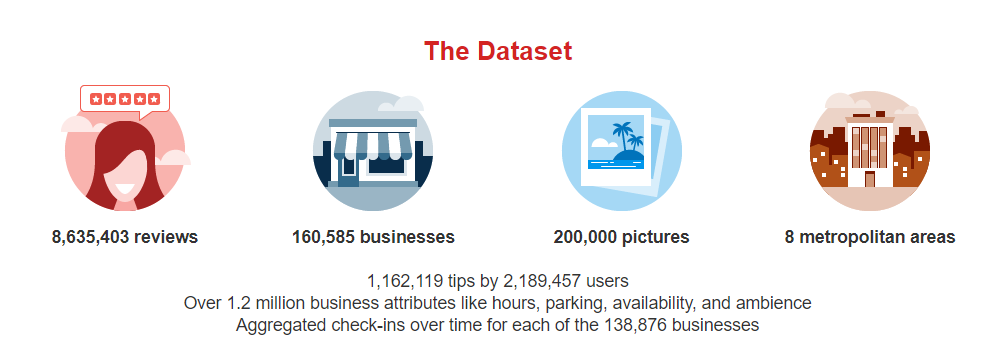
Data overview
Data Preparation
Yelp provides APIs/ datasets in ISON format. Three separate datasets on business information, reviews, and user details are available. The size of these files is way too large to handle by Pandas or Dask directly, so we have used Pyspark instead for reading the data and filtering some samples out of it.
import pandas as pd
from pyspark.sql import SparkSession
import pyspark.sql.functions as F
from pyspark.sql.window import Window
spark = SparkSession.builder.appName('yelp_dataset').getOrCreate()
reviews_sk = spark.read.json('/content/yelp_academic_dataset_review.json')

# We will get a sample of 10L from the dataset
sample_review=reviews_sk.sample(False, 0.1, seed=0).limit(1000000)
reviews_pd = sample_review.select("*").toPandas()
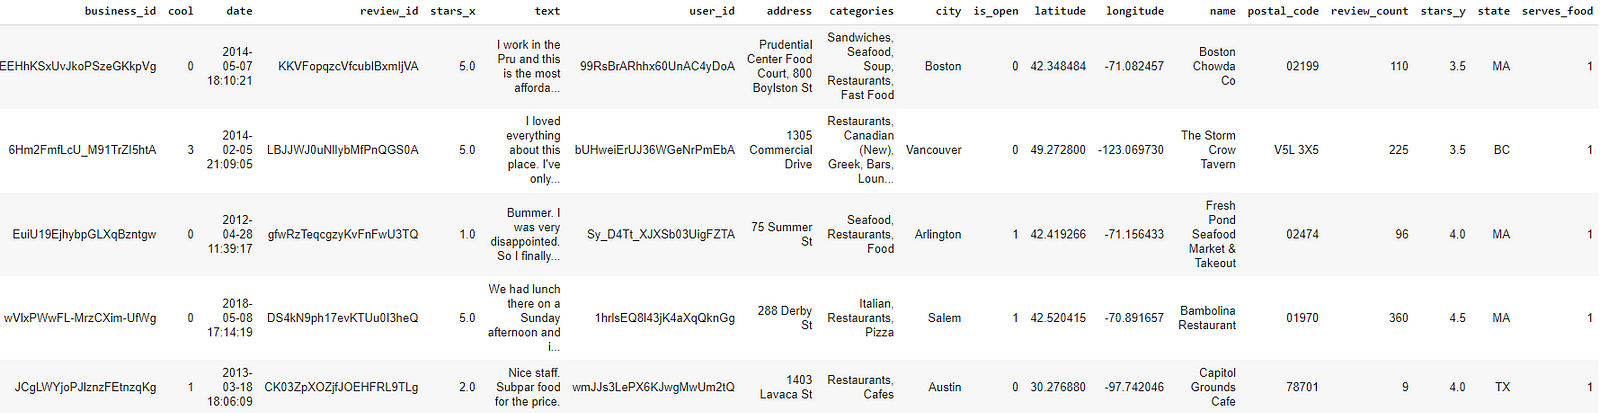
The dataset is almost clean. We will filter the samples for businesses that serve food and merge them with the review dataset. After all these operations, the final dataset will look something like this
Overview of the Approach
Now when we are clear on our objective, let’s discuss our approach to tackle the tasks at hand.
Problem1: We need to create a dashboard app that will able to put the information from a dataset into graphs
Proposed Solution: We will use the Plotly dash framework to develop a flask(a python Web application framework for API development) based dashboard application. To keep our application simple, there will be a dropdown to select the business at the left and we will update the metrics on the input value received. The details of these metric visualizations are available in the notebook out there in my git repo. We have extensively used the dash bootstrap components which make data professionals’ life easier for UI designing. Dash has a concept of callback which is used to update certain UI components. Please refer to this link for the dash documentations.
Problem2: We want to find out the trending keywords from the reviews of our customers to understand the feedbacks more closely and quickly.
Proposed Solution: Now we will address this problem with the help of the keyword extraction method of natural language processing. Keywords are the catchphrases of a sentence/ corpus which are very effective to understand the motto of the sentence/ corpus very quickly.
For this POC we have ranked the businesses based on the total number of reviews available in the sample and restricted them to Only the top 5 businesses from this list. The reviews from these businesses have gone through the standard cleaning and preprocessing techniques like stop word removal, lemmatizing, etc. used in NLP.
Now let’s understand how we will extract the keywords. Before that, we need to be aware of a concept called word embeddings. Intuitively we can think of the embedding as a multidimensional vector representation of words. These representations are obtained using neural networks(Word2Vec, Glove, BERT, etc. are popular algorithms in this space) We have used the distilBERT for the purpose of converting the words from most recent reviews into vectors. Similarly, we will convert the whole corpus/ document (in our case reviews from the last 7 days) into a vector. Now intuitively we can think the words that have a similar embedding to the document will be considered as Keywords.
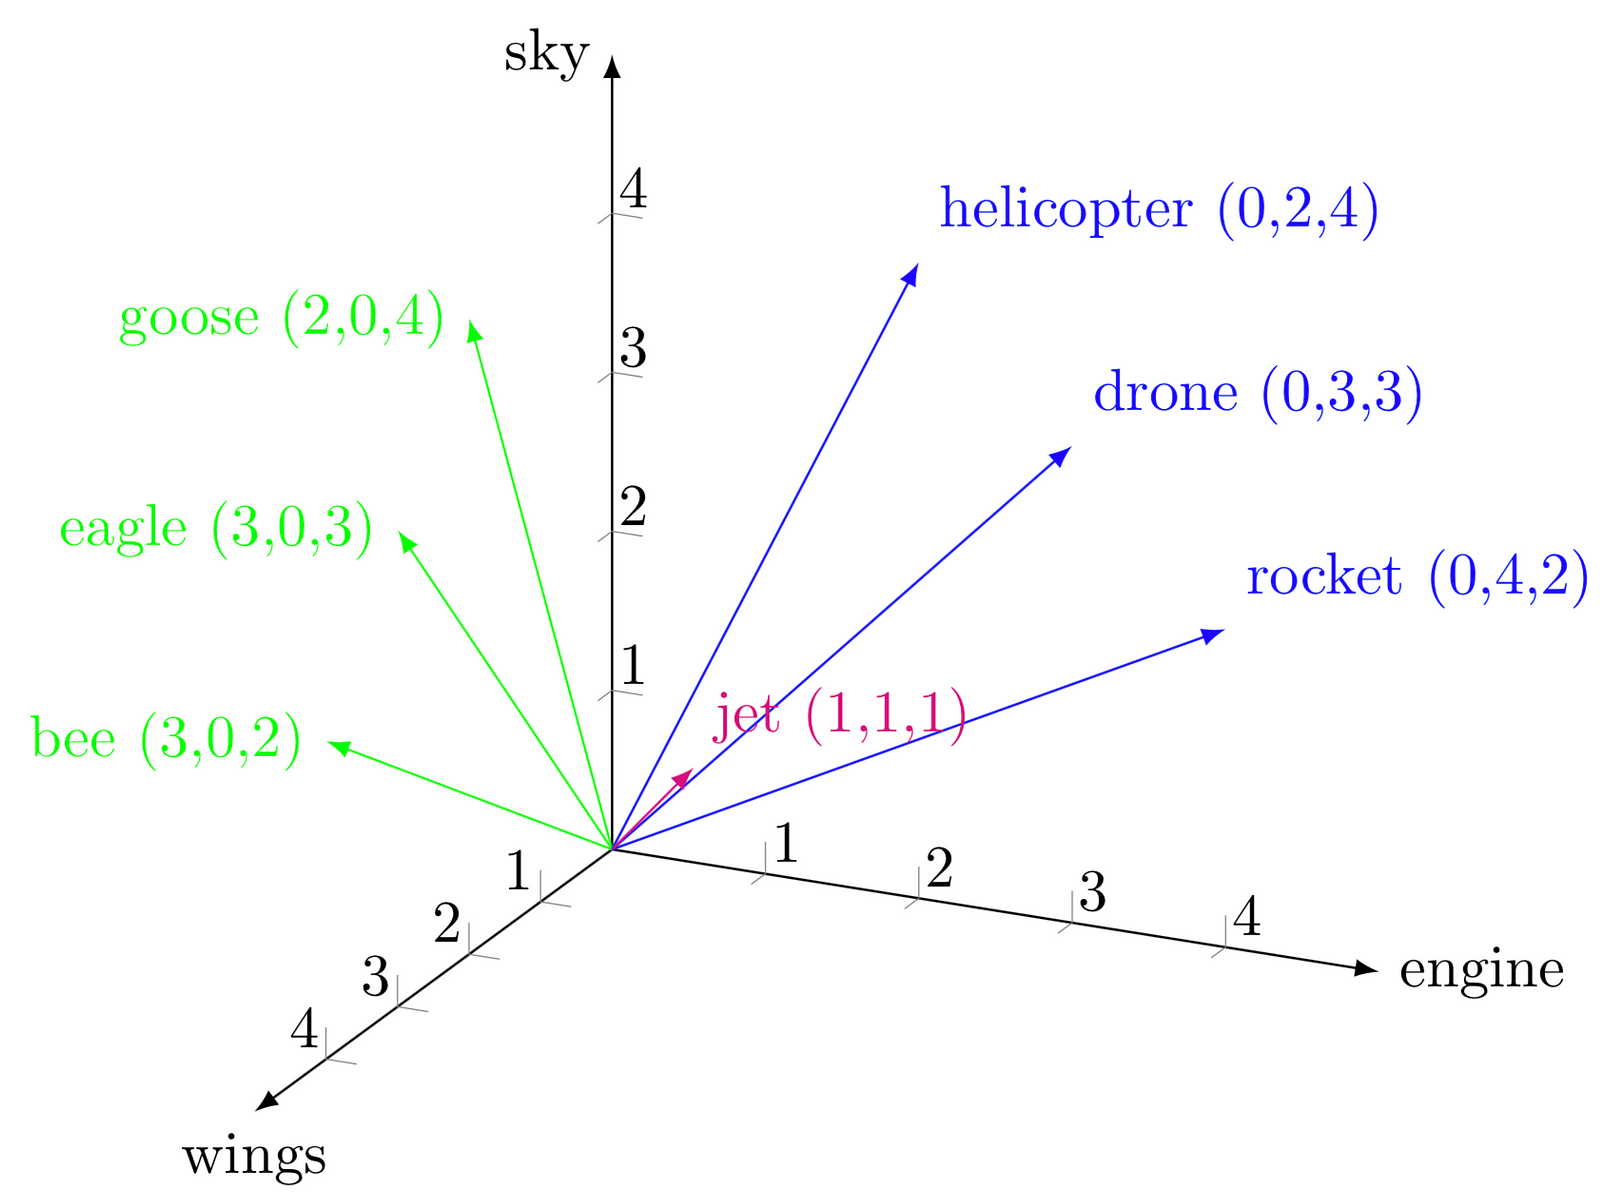
But how Can we compare the similarity between these vectors? Here the concept of cosine similarity comes into the picture. without going into much detail
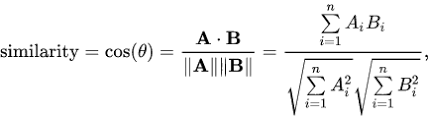
where Theta is the angle between two vectors A and B. If theta is 0, cos 0 becomes 1 meaning the vectors are completely similar.
So we can calculate the cosine similarity between the candidate words(words with higher TF-IDF score) and the document then return top words based on the similarity score. Now, these words will be almost similar, to diversify the keywords we can use distance-based algorithms like Max Sum Similarity. Please find more details in this brilliant article.
Max sum Similarity implementation
 # https://towardsdatascience.com/keyword-extraction-with-bert-724efca412ea
    def max_sum_sim(self,doc_embedding, candidate_embeddings, candidates, top_n, nr_candidates):
        # Calculate distances and extract keywords
        distances = cosine_similarity(doc_embedding, candidate_embeddings)
        distances_candidates = cosine_similarity(candidate_embeddings,
                                            candidate_embeddings)
        # Get top_n words as candidates based on cosine similarity
        words_idx = list(distances.argsort()[0][-nr_candidates:])
        words_vals = [candidates[index] for index in words_idx]
        distances_candidates = distances_candidates[np.ix_(words_idx, words_idx)]
        # Calculate the combination of words that are the least similar to each other
        min_sim = np.inf
        candidate = None
        for combination in itertools.combinations(range(len(words_idx)), top_n):
            sim = sum([distances_candidates[i][j] for i in combination for j in combination if i != j])
            if sim < min_sim:
                candidate = combination
                min_sim = sim
        return [words_vals[idx] for idx in candidate]
Extract keywords using the similarity score
    # Diversify the keywords using max sum similarity, higher the value of nr_candidates higher the diversity
    def extract_keywords_bert_diverse(self,doc,stopwords,top_n=10,nr_candidates=20):
        n_gram_range = (1,1)
        # Extract candidate words/phrases using count vectorizer (TF-IDF Scores)
        count = CountVectorizer(ngram_range=n_gram_range, stop_words=stopwords).fit([doc])
        candidates = count.get_feature_names()
        # Embeddings of the document using Bert
        model = SentenceTransformer('distilbert-base-nli-mean-tokens')
        doc_embedding = model.encode([doc])
        candidate_embeddings = model.encode(candidates)
        keywords=self.max_sum_sim(doc_embedding, candidate_embeddings, candidates, top_n, nr_candidates)
        return keywords
Implementation Overview
We will briefly discuss the implementation steps for these metrics. Let’s read the data and see a few samples first
# Read the data and delete uninterested columns
review_business_data_merged=pd.read_csv('/content/drive/MyDrive/yelp_reviews_business_merged.csv')
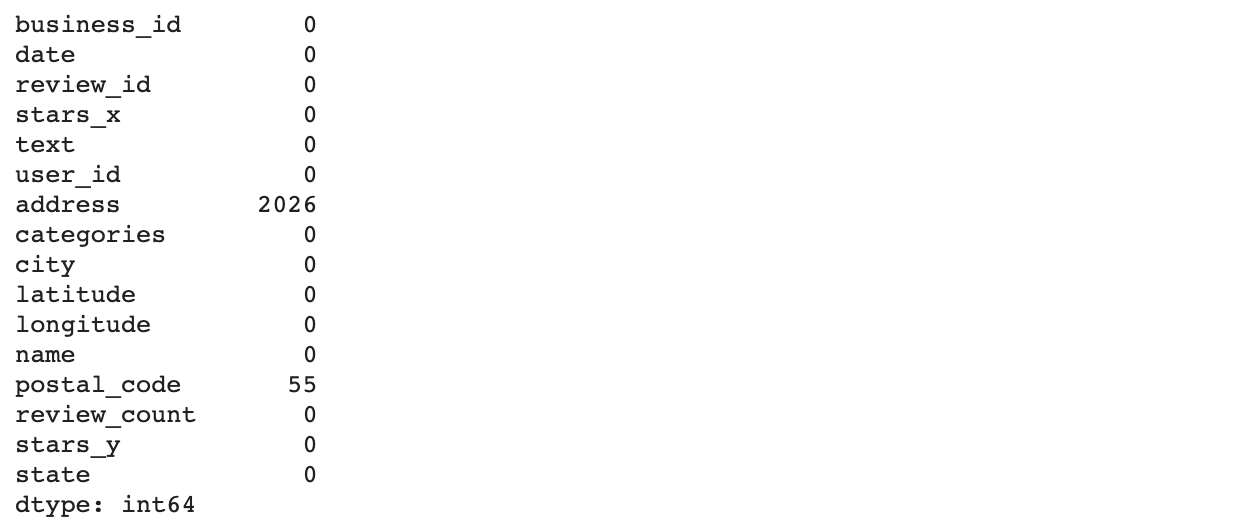
review_business_data_merged=review_business_data_merged.drop(columns=['Unnamed: 0','cool','funny','attributes','is_open','serves_food','useful','hours'])
# Null Check
review_business_data_merged.isna().sum()
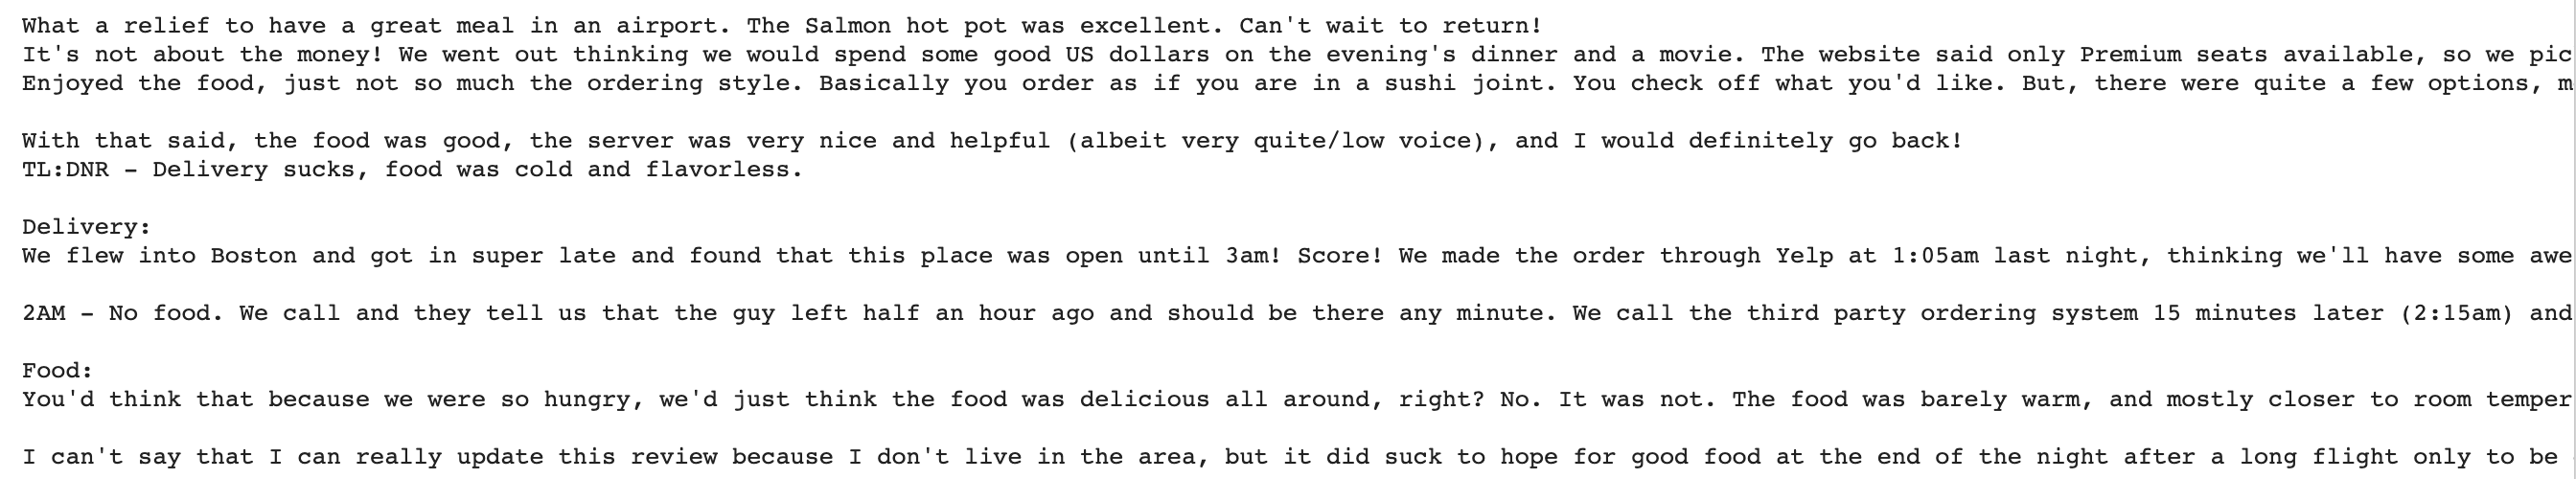
Sample Reviews
print(review_business_data_merged.iloc[123]['text'])
print(review_business_data_merged.iloc[1243]['text'])
print(review_business_data_merged.iloc[23]['text'])
print(review_business_data_merged.iloc[389]['text'])
The stars_x column provides the rating of the user, we will map this into sentiment score. Any rating with 3 stars will be considered neutral, above 3 will be positive, and less than 3 will be considered as a negative review. We will also restrict our system to the top five businesses having the most reviews.
Mapping the sentiments with the Reviews
# starts 4-5: Positive(1), stars 1-2: Negative(3), stars 3: Neutral(2)
def map_sentiment(rating):
    if(int(rating)==3):
        return 2
    elif(int(rating)<3):
        return 3
    else:
        return 1
review_business_data_merged['stars_x']
review_sentiments=[map_sentiment(s) for s in review_business_data_merged['stars_x']]
review_business_data_merged['sentiments']=review_sentiments
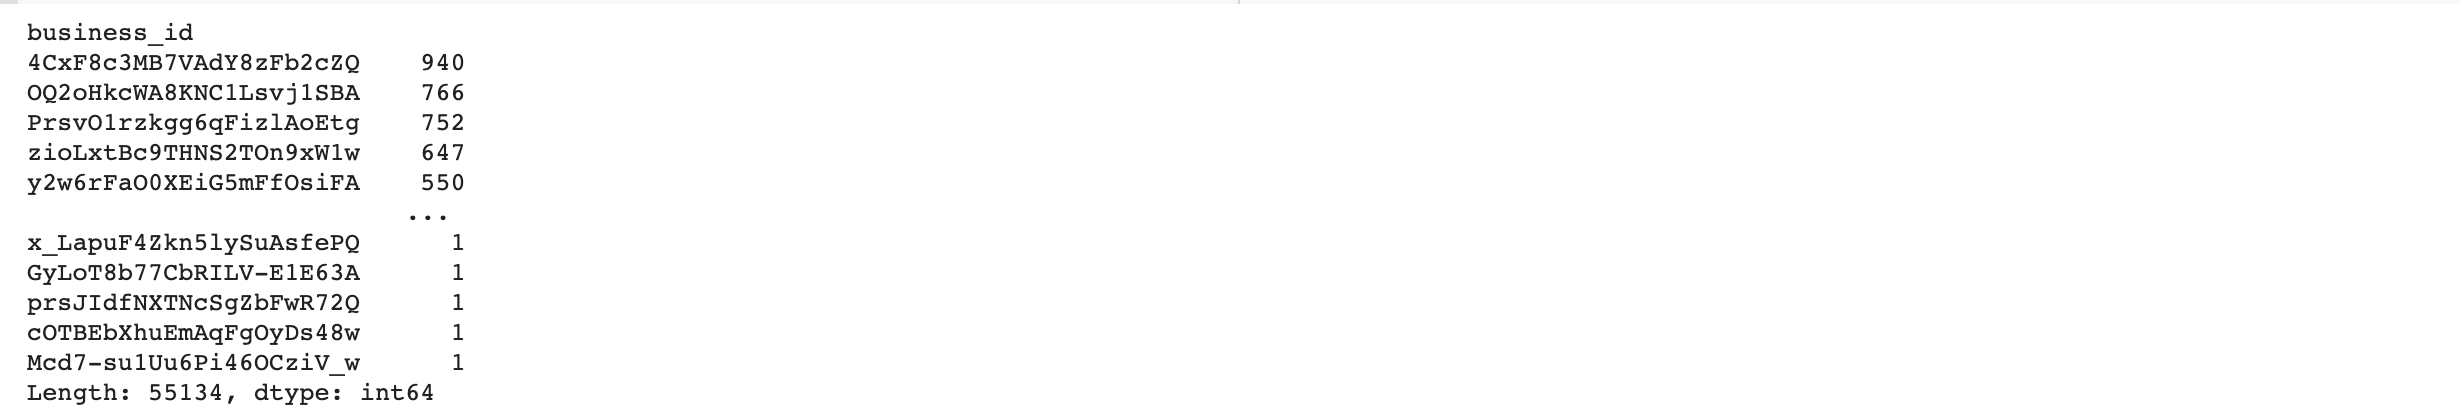
Ranking the businesses based on the number of reviews
review_business_data_merged['date']=pd.to_datetime(review_business_data_merged.date)
review_business_data_merged.value_counts(['business_id'])
We can then plot the required metrics using the Plotly library as below, we can use the same thing to plot other required metrics.
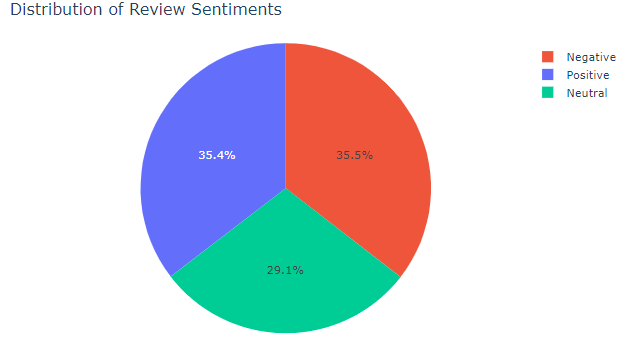
Sample metric: How the sentiments are distributed?
sentiment_names=[sentimments_dict[int(i)] for i in data_most_reviewed_store['sentiments'].values]
data_most_reviewed_store['sentiment_name']=sentiment_names
fig = px.pie(data_most_reviewed_store, values='sentiments', names='sentiment_name',color='sentiment_name',color_discrete_map={'Neutral':'yellow','Negative':'cyan','Positive':'green'})
fig.update_layout(
     autosize=False,
     title='Distribution of Review Sentiments'
    )
fig.show()
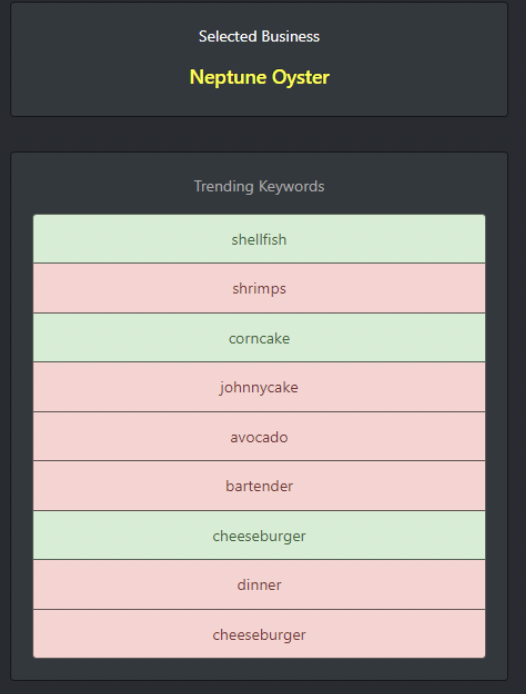
We have already discussed the intuition behind extracting the keywords from recent business reviews, we can create a script for this containing the below methods, where we will extract the keywords from the most recent 500 reviews from each of the sentiment brackets.
# Method to get the trending keywords
def get_trending_keywords(self,data_most_reviewed_store,num_keywords=5):
        # Stopwards
        stopwords_ = list(set(stopwords.words("english")))
        stopwords_+=['voodoo','doughnuts','doughnut','voodoodoughnut','donut','donuts']
        # Filtering the dataset based on Review Sentiments
        positive_reviews=data_most_reviewed_store[data_most_reviewed_store['sentiments']==1]
        negative_reviews=data_most_reviewed_store[data_most_reviewed_store['sentiments']==3]
        neutral_reviews=data_most_reviewed_store[data_most_reviewed_store['sentiments']==2]
        preprocessed_texts_neg=self.preprocess(negative_reviews.text.values,stopwords_)
        preprocessed_texts_pos=self.preprocess(positive_reviews.text.values,stopwords_)
        preprocessed_texts_neu=self.preprocess(neutral_reviews.text.values,stopwords_)
        keywords={}
        corpus=' '.join(preprocessed_texts_pos[-500::])
        keywords['positive']=self.extract_keywords_bert_diverse(corpus,stopwords_,num_keywords)
        corpus=' '.join(preprocessed_texts_neg[-500::])
        keywords['negative']=self.extract_keywords_bert_diverse(corpus,stopwords_,num_keywords)
        return keywords
Now with the help of the dash bootstrap component, we will convert the response to something like this in the dashboard
Launching the Application in Local
We can easily add the code blocks from the notebook to create a python script and let Dash handle the rest. To get a quick taste of how it will look follow the below steps:
Download the Dash.zip file from the repository mentioned at the end of this article. Go to the terminal, install the required libraries using the requirments.txt file. Once it’s completed run the application.py file. A flask API will be created in the local server and the application will start.
Designing the workflow in AWS
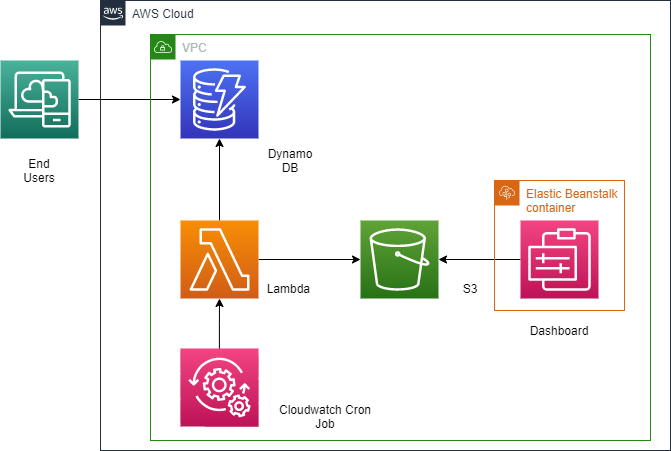
Deploying the Application
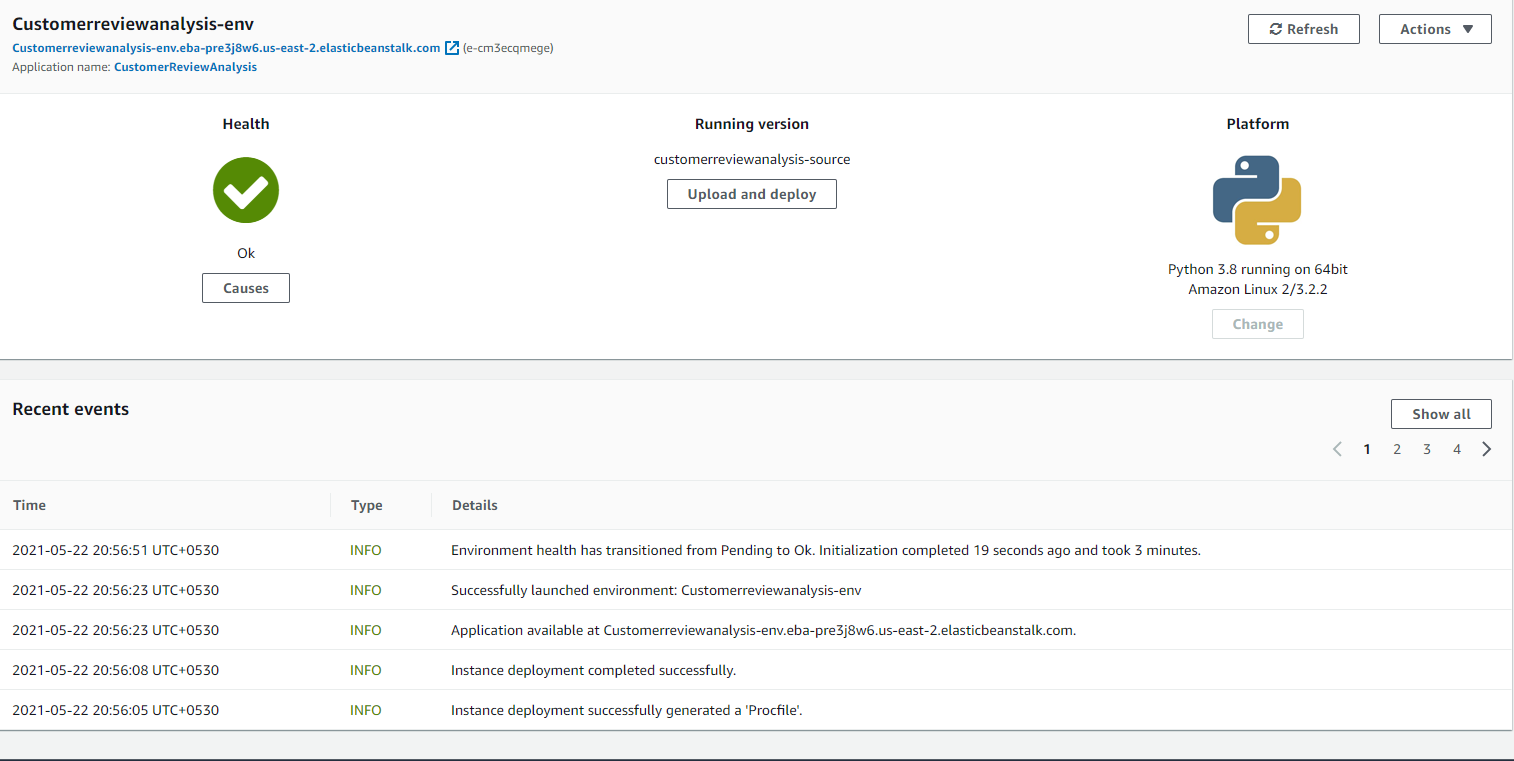
For the sake of this prototype, we will not go through all this complexity, we will just bound the data and code together in a zip file and deploy it via elastic beanstalk console. The details are available in the deployment guidance document in the repository. Once the deployment is completed successfully, you will able to see a screen like this in the Elastic Beanstalk console. Clicking on the like with start the application on cloud.
Conclusion
Voila! finally, we have hit the end. The main purpose of this article was to approach a business problem the right way towards a working prototype. There are multiple ways to improve the solution and adding new features as per the business use-case. The link to all the source code and other necessary resources are mentioned below. Happy Learning.
- Repository: https://github.com/arpan65/Customer-Review-Analysis-SaaS
- https://huggingface.co/transformers/model_doc/distilbert.html
- https://towardsdatascience.com/keyword-extraction-with-bert-724efca412ea
- https://dash-bootstrap-components.opensource.faculty.ai/docs
- https://github.com/plotly/dash-sample-apps/tree/master/apps
About the Author
Arpan Das
I am currently working as a Product Specialist in Cognizant, involved in solving business challenges for the P&C Insurance sector. My core competency is Machine learning, AWS, P&C Products(Duck Creek Claims), and python having intermediate-level experience in Computer vision and NLP. Interested in reading and writing about core concepts and latest developments on Data Science and Insurance. Please feel free to connect with me on LinkedIn.
The media shown in this article are not owned by Analytics Vidhya and are used at the Author’s discretion.


