Chart Selection Guide
The Data Visualisation Catalogue
JANUARY 1, 2021
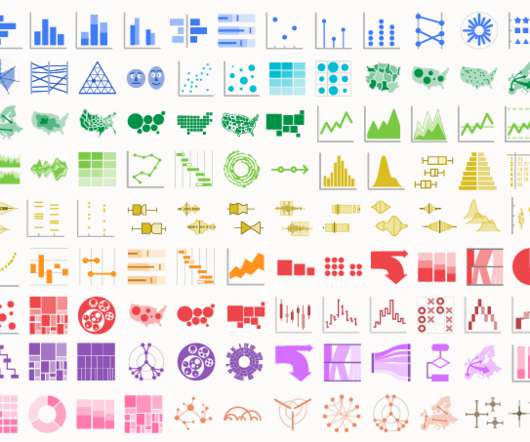
On the site’s Instagram , there’s a series of posts that each list with icons, the chart types recommended based on what you can communicate or analyse with them. In total, there were 15 posts created, each with a particular category and color theme. Essentially, these were an updated, Instagram version of the ‘What do you want to show’ page here on the site, but with some new types of charts covered.


Let's personalize your content