How to Use Graph Theory to Scout Soccer
Take Soccer Analytics to the Next Level with Graph Theory: Here’s What to Know and How to Do It.
Not all networks are social! Graph theory flexed its muscles with the rise of social networks. But what can it do for sports analytics? What if we model soccer passes as a network? Can we learn which team is more likely to win? Can we identify critical players to pressure the opposing team? Can we identify opportunities to improve our team’s performance?
To find out, we can use the Statsbomb API to access free data on every pass in the 2018 World Cup.
What is Graph Theory for Soccer?
A ‘network’ is the everyday word for what data science calls a graph. In analytics, a graph is a formal way to represent a group of interconnected objects. This is borrowed from math where graphs are defined as ordered pairs that include a set of nodes and a set of edges.
The terminology makes more sense with an example. Let’s see what a graph of soccer passes might look like:

For us, a team passing graph is the combination of these attributes for all matches played by a given team in the 2018 World Cup.
Now let’s see what kind of graph analytics come out-of-the-box. These are the common metrics we can use to investigate the pass network properties of a given team or player:

Eigenvector (EV) Centrality merits extra explanation. It involves the concept that not all nodes are the same. It weights each node based on its relative influence. Think about a social network where you have a reliable connection to Kim Kardashian.
Approach
This project is coded in Python using Google Colaboratory and is available on GitHub. The workflow is straightforward:

Use the Statsbomb API to load the 2018 World Cup event data. Filter our data to retain only passing events. Then create directed weighted graphs for each of the 32 teams using the 34,580 observed passes during regular play. This number excludes 28,292 passes during throw-ins, period starts, corner kicks, etcetera.
Findings: Graph Analytics is Correlated with Performance
Using ‘out-of-the-box’ methods from the NetworkX library, we calculate basic graph analytics for each team and player. Let’s look at a few findings:
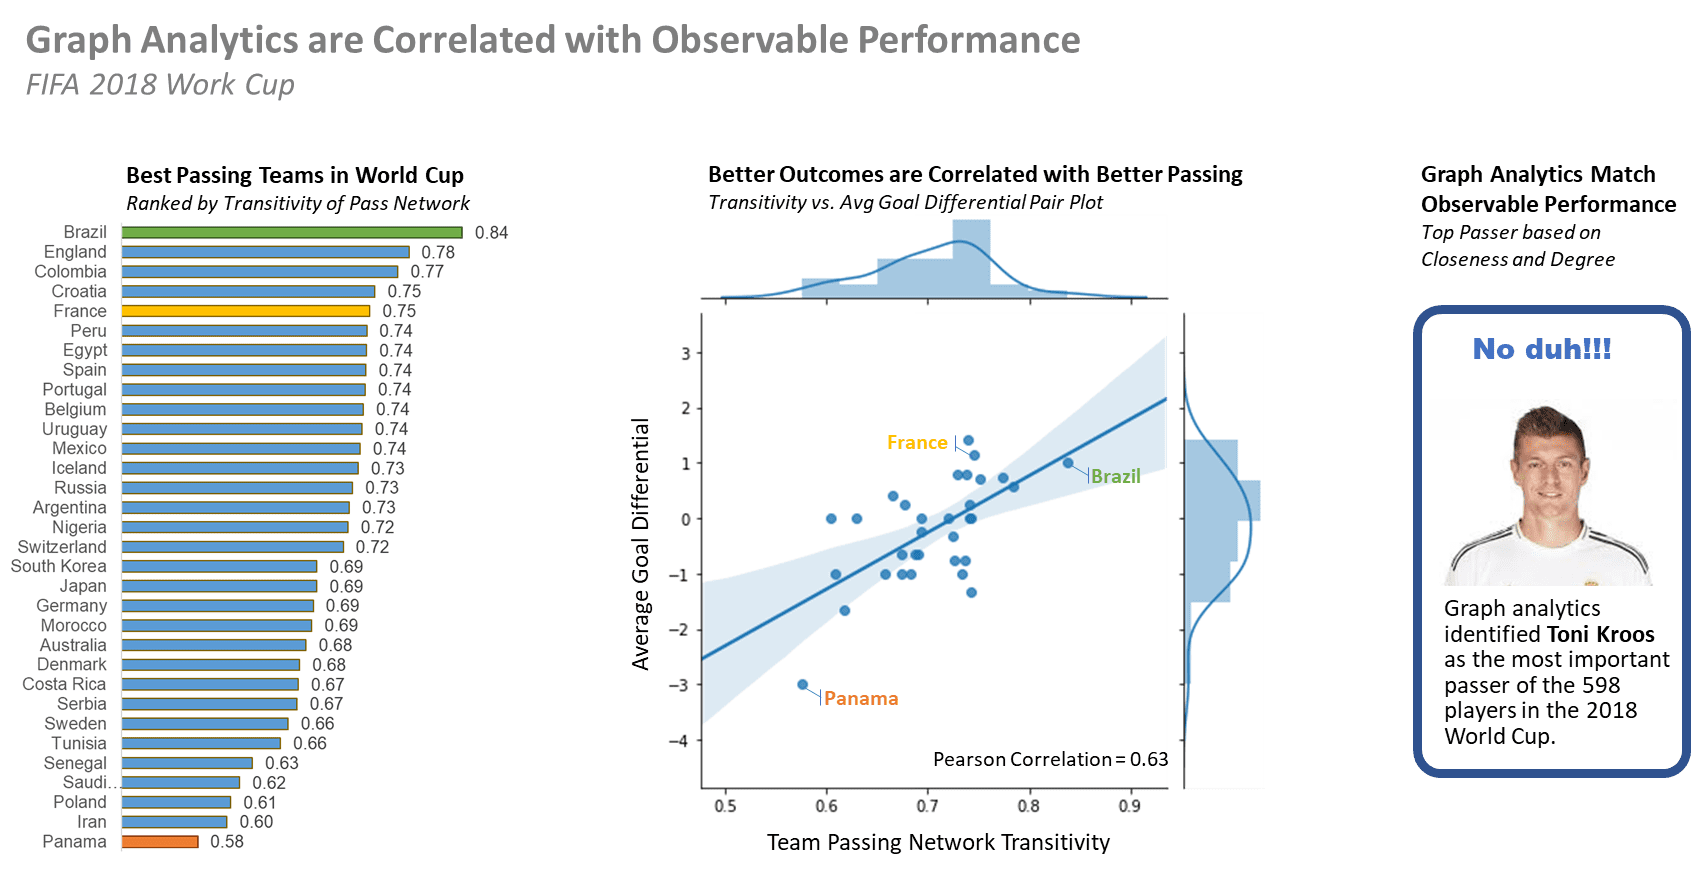
Three squads are highlighted in the team analysis above. Brazil because they won on paper. They stand out as having the best passing metrics. Panama is at the other end of the spectrum. France is highlighted because they won where it counts, on the pitch.
The key takeaway is that high passing network transitivity doesn’t guarantee to win the World Cup, but it is the ante to reaching the semi-finals. It’s like Billy Beane says in Moneyball, “My s^%t doesn’t work in the playoffs. My job is to get us to the f%&#ing playoffs. What happens after that is luck.”
We also evaluated individual pass network metrics for each of the 598 players. Toni Kroos rose to the top as measured by closeness centrality and degree. To see if this checks out with observable evidence we can search for “Toni Kroos passing” on YouTube. This yields 6,240 video results with titles like: “The King of Passes”, “Sniper Accurate Long Passes”, “No One Passes like Toni Kroos!”, and “The Art of Passing.”
Compare Analytics between Teams at the Extremes: Brazil and Panama
Now let’s compare the two teams at the extremes. Brazil is the standout as quantified by passing network transitivity, which is a measure of how tightly each subgroup of three players is connected. We will contrast with Panama who is at the other end.
We can plot each player’s influence on the team’s passing network on the y-axis. This is based on the player’s Eigenvector Centrality during the matches. Then use the x-axis to plot the player's average downfield passing distance. Here is our comparison of the two teams:

Right off we see Brazil’s players are more tightly grouped in comparison to Panama. Brazil utilizes shorter passes and there is less difference between the most and least influential passers. As we would expect, the defensive backs (the lightly shaded nodes) tend to be on the right of the plot with passes that travel further downfield.
The scouting report for Brazil might suggest trying to disrupt Neymar who is the most influential player in the team’s passing network. But this plot indicates that may be ineffective because there is not a significant gap with the rest of the team. However, we do see a heavy edge between Neymar and Countinho. This suggests that clogging the passing lanes between these two players might be helpful.
By comparison, the Panama scouting report highlights that Godoy, the right-center midfielder, is the most influential player in the Panama passing network. Putting increased pressure on Godoy may have a disruptive impact on the team.
Conclusion
As a proof-of-concept, we see that graph analytics can be useful in soccer to identify influential players and provide quantitative measurements of passing styles for both teams and individual players.
The complete code base including data access is available at: https://github.com/FauxGrit/Soccer-Graph-Analytics
Bibliography
[1] John Laschober and Amanda Harsy. “Analysis of Passing Networks in Soccer.” Vol. 1 No. 1 (2020): Mathematics and Sports.
[2] Javier M. Buldú, Javier Busquets, Johann H. Martínez, José L. Herrera-Diestra, Ignacio Echegoyen, Javier Galeano, and Jordi Luque. “Using Network Science to Analyze Football Passing Networks: Dynamics, Space, Time, and the Multilayer Nature of the Game.” October 2018: Frontiers in Psychology.
[3] Arriaza, Enrique & Martin-Gonzalez, Juan & Zuniga, Marcos & Flores, Josh & Saa, Y. & García-Manso, J.M.. (2017). “Applying graphs and complex networks to football metric interpretation. Human Movement Science.” 57. 10.1016/j.humov.2017.08.022.
[4] Benito Santos A, Theron R, Losada A, Sampaio JE, Lago-Peñas C. “Data-Driven Visual Performance Analysis in Soccer: An Exploratory Prototype.” Front Psychol. 2018 Dec 5;9:2416. doi: 10.3389/fpsyg.2018.02416. PMID: 30568611; PMCID: PMC6290627.
[5] Brandt, Markus and Ulf Brefeld. “Graph-based Approaches for Analyzing Team Interaction on the Example of Soccer.” MLSA@PKDD/ECML (2015).
Matt Semrad is analytics leader with 20+ years of experience building organizational capabilities in high growth technology companies.