
I see a lot of Power BI projects that we are asked to fix or performance tune, and in at least nine out of ten times, the answer is that the data needs to be shaped and transformed so it is optimized for reporting; and this is not an exaggeration. Reshaping data is often an iterative process, which means that a developer might need to try a few options before finding the right pattern and the best method to transform tables into the right schema.

Getting Data Into Shape
for Reporting with Power BI
Even for small, informal BI projects, shaping the data into a dimensional model alleviates complexity, speeds up slow calculations and reduces the data model storage size. I conclude this post by reviewing seven data architectures and the data shaping methods with different degrees of scale.
Old Meets New – but doesn’t change the rules
Power BI is a new tool and dimensional modeling is an old idea. One of the challenges is that, like other modern self-service analytics products on the market, Power BI doesn’t force self-service data jockeys to transform their data before reporting with it. If you want to import a big, wide spreadsheet full of numbers and create charts in a Power BI report, knock yourself out. But, the solution won’t scale and you will inevitably run into walls when you try to make future enhancements. Similar problems arise from importing many tables from different sources and transactional systems. Several tables all chained together with creative mashups and relationships present their own set of problems. The first iteration of such an effort is usually a valuable discovery method and learning experience. Great… treat it as such; take notes, make note of the good parts and then throw it away and start over! In Fredrick Brooks’ “The Mythical Man Month“, he cites that for most engineering projects, the first six attempts should be abandoned before the team will be prepared to start over and complete the work successfully. Brooks was a chemical engineer before working for IBM; and hopefully, our methods in the data engineering business are more effective then his 6-to-1 rule. But, this makes the case the prototypes and proof-of-concept projects are a critical part of the learning path.
Natural Laws of Physics and Data
How important is it that tables be prepared in dimensional format? Is this 30-year-old design pattern antiquated and unnecessary? Can non-dimensional, flat or normalized tables and files be used or transformed within Power BI? Yes, but it depends (Patrick Leblanc: please put a dollar in the jar).
In life, we often want things to work a certain way, and to a certain degree, things do until the problem is applied at scale. As a kid, I wanted to put a rocket engine on a car. Fortunately someone else tried it before I had a chance. Answers to the greatest questions are often related to natural laws. Newton didn’t invent gravity. He discovered it. Einstein didn’t invent the physical laws that govern the relativity between mass, time and motion. He discovered this reality by forming a theory and then proving it mathematically. Likewise, the behavior of data cannot be forced. It can only be discovered and then embraced.
Here’s a super-quick history lesson about database schema design and some of the industry superheroes who figured out how to shape data for various purposes:
Back in the late 70’s Dan Bricklin invented the spreadsheet, paving the way for products like VisiCalc, Lotus 1-2-3 and Microsoft Excel. When most business users need to track, count or organize data, they use Excel or Google Sheets. By most accounts today, there is more data in Excel workbooks than any other data format on the planet. Also, in the 70’s, Edgar Codd and David Boyce from IBM defined the Boyce-Codd Rules of Normal Form (BCNF) for relational databases. This became the standard that drives nearly all transactional database system today; with many related tables storing large volumes of detailed data. Bill Inmon envisioned the data warehouse, the basis for analytical reporting. In the 90’s Ralph Kimball and his group meticulously defined the rules and process for dimensional modeling. The Kimball Method was an effort to balance the discipline of BCNF with the efficiency of reducing redundancy and the number of relationships needed for read-only, analytic reporting. All that said, Microsoft have designed their data warehouse and BI reporting tools in concert with the Kimball approach and for that reason, using the “star schema” dimensional design will nearly always achieve the best result for modeling analytic data.
Here’s another natural law that should be paired with dimensional design. Matthew Roche, a popular speaker, blogger and member of the Power BI Customer Advisory Team (CAT), coined a directive that is now often quoted as “Roche’s Maxim of Data Transformation“.
Matthew said: “Data should be transformed as far upstream as possible, and as far downstream as necessary.“
Mic drop, Mr. Roche.
Dimensional / Star Schema Design – Yea, It’s Important
The advantages of star schema design are well documented so I won’t reiterate here, but you can find many good articles on the topic, such as:
- Doing Power BI the Right Way: 5. Data Modeling Essentials & Best Practices (1 of 2) | Paul Turley’s SQL Server BI Blog
Understand star schema and the importance for Power BI – Power BI | Microsoft Docs - Why Power BI loves a Star Schema – YouTube
- Data Modeling (Star Schema 🌟) in Power BI – Creating Dimension Tables – YouTube
Freedom to Make a Mess
More and more of my exposure to Power BI project work these days comes from technical oversight on projects being wrangled by people on my team. I’ve always enjoyed being in the trenches solving business problems with BI technical tools, and I’m now supporting other consultants as well; and the most challenging projects demand the most attention. Consulting clients often ask us to fix projects they have started but then got stuck, with performance problems and other requirement gaps. Why am I telling you this? …because I see a pattern: Complex, difficult-to-manage Power BI projects that have slow performing reports, query work-arounds and overly-complicated measures and calculation logic don’t follow conventional dimensional design practices. This is the one, consistent factor in overly-complicated and challenging Power BI projects.
Power BI is a flexible tool that doesn’t force developers to transform data into fact and dimension tables before it can be used for reporting. Dimensional Modeling is a strict and well-defined process and in earlier incarnations of Microsoft BI technologies like OLAP Services and SQL Server Analysis Services, source tables had to conform to dimensional rules but in Power BI, this is no longer that case. Freedom is a complicated thing and that is what Microsoft gave us in the form of Power BI.
Microsoft are successful because they listen to feedback and make software to meet the needs of paying customers. They don’t tell people that they shouldn’t use their software in a certain way. They might provide guidance, and make suggestions but they won’t stop anyone from doing what they want with their products. Since the vast majority of business software users are not data experts, they are thrilled to have a product that lets them click a button to automatically get some data and turn it into a chart!
Back In My Day
Before Power BI, if you developed a cube using multidimensional SSAS, you started with the “UDF” (Unified Dimensional Model), a layer of abstraction that forced dimensional relationships and cardinality rules. From one perspective, it made sense to enforce that the rules be followed so models performed well and gave reliable results. However, competing self-service BI vendors like Tableau and Qlik don’t force these rules and Microsoft needed to make Power BI as easy, or easier, to use as the competition. So, the dimensional model is a double-edged sword… it requires technical savvy and discipline to the potential exclusion of novice BI users.
The tool we used way back in the day was DTS (Data Transformation Services) or the “newer” SSIS (SQL Server Integration Services) to create ETL packages. These packages contain transforms used to reshape data records as they flowed from one transform to another. Today we can use ADF (Azure Data Factory) or Synapse pipelines to perform very similar data reshaping between data stored in cloud services. In simple cases, we could use SQL queries and stored procedures to move data from staging tables into fact, dimension and bridging tables in the data warehouse schema. The same is true today. In many cases SQL script may be used in a similar fashion, whether the source data resides in files within a data lake or within a relational database, the general pattern is still the same.
A Simple Example
How is data transformed from a flat file or table into dimensions and facts? There are some very thick books on this topic that cover the process in explicit detail. The process is explained on the Kimball Group site.
This is just a simple example but it demonstrates the general pattern – which could be performed using a series of SQL queries, an SSIS package, ADF/Synapse pipelines or Power Query – in Power BI. Let’s say that we have a file extracted from a system of record that produces a flat table similar to this one:
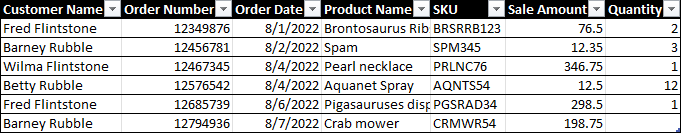
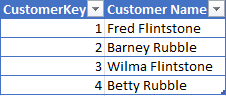
You can see that over time, we have the same customers buying different combinations of products, creating redundant values in the customer and product name columns. The first step is to extract the unique customer information into a separate table and generate unique surrogate keys. This becomes the new Customer dimension table:
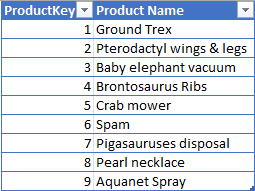
We can do the same thing with the products to produce the Product dimension table:
By matching the original customer and product name values in the source table, we can lookup the newly-generated surrogate key values and insert them into a new Sales Order fact table that stores only the numeric key values.
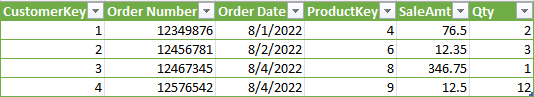
What about that Order Number? Doesn’t that suggest that there should be a separate Order dimension table? I purposefully left that in the fact to make the point that there are appropriate exceptions to the rule that all dimensional attributes should be removed from a fact. In this case, since these fact records are stored at the order level – rather than perhaps individual order line transaction items, this might be the right approach. There are trade-offs but make such decisions based on the most effective way to shape the data instead of because of “that’s the way the data was”.
The process isn’t rocket science but it can get a little more complicated as we encounter some inevitable data quality issues like misspelled values and duplicate records, and records that change over time. These challenges are real and represent just some of the complexities involved in the data engineering process. That’s a topic for another time. Our take-away for now is that by moving the dimensional data into separate tables, the fact tables become narrow & lean, and far more efficient to store and manage data. In this scenario, imagine for now that the new Sales Orders fact table has three related dimensions: Customer, Product and Date.
The Problem with Doing It Right
Applying a strict discipline and “always right” rules can be expensive and time-consuming, which brings us to the difficult question of achieving balance between “near perfect” and “good enough”.
We recently worked with a new client who brought us an existing Power BI project that was all over the map. I mean, it was a mess! The goal was to reconcile monthly financials from one month to another, and the client asked us to tune and optimize their report and data model. One of our newer consultants had the pleasure of doing the initial analysis before bringing it to me. Imported from report extract files, each table contained records for a certain month. Summary values and totals were precalculated. Most tables stood alone, with no relationships. The solution met the original purpose but then failed when new reporting requirements were added. The data volume was very low and wasn’t likely to increase significantly as new records were introduced each month. The solution, from my perspective, was to use Power Query to reshape data into two fact tables and three or four simple dimensions. The work might take two or three weeks. When we recommended that we start over and redesign the solution from scratch, citing that they would gain a significant return on the investment, our client (the developer who had created the original solution) got upset and told their leadership that we were uncooperative and didn’t know what we were doing. After all if we were right, we had exposed significant flaws in the design. Welcome to the complexities of consulting!
Where Should We Reshape Our Data?
I’ve made the case for applying dimensional design in nearly all Power BI projects. So, how should data transformations be applied? What tools should be used and at what stage in the process should reshaping take place?
Are you ready? …It Depends (another $, Patrick). It depends on things like scale and ownership. Let’s start small and then work up. One great thing about using a standard architecture pattern is that the solution can scale, so you can graduate from one to another. Let’s take a look at a few of these data architectures.
This first graphic depicts a very typical Power BI scenario. The data sources contain data that cannot be manipulated for various reasons before we bring it in. These may be static files or a structured data source that we don’t own or control. Therefor, the opportunity to perform data transformation, after the data has been brought into the Power BI environment, will be to use Power Query with the queries authored in Power BI Desktop.

This approach is simple and gets the job done, but it lacks the ability to scale or to be reused. Since the data transformations are performed in the PBIX report file, the output of the transformation queries cannot be shared with other data models or reports.
Dataflows and Power Query
The second example is similar to the first but using a Power BI dataflow, the transformation queries are authored in a web interface and stored in the Power BI service where they can be shared with multiple data models and reports. Power BI dataflows is an implementation of the Power Query transformation engine that lives in the Power BI cloud-based service. An advantage to using dataflows is that that queries can be shared among multiple datasets. The features are roughly the same but dataflows provides a little more scale and flexibility than recreating queries using Power BI Desktop. However, dataflows are not a replacement for a data mart or data warehouse. If you already have a dimensional database, dataflows might be an unnecessary layer but Microsoft does implement a few attractive features such as AutoML and streaming datasets, only when you use dataflows in a Premium workspace.
Dataflows are an effective way to centralize a set of table definitions at a moderate scale and then the dataflow can be reused in other data models. If you know how to use Power Query, you can apply it either in the Desktop tool or in a web-designed dataflow.

Next, we introduce a relational database as a data mart. Since properly shaped fact and dimension tables are stored in the database, little transformation is necessary in Power BI. Some reshaping work can be done in Power BI to meet special report requirements but the heavy lifting is all done either within the database, or in an upstream process before it reaches the database. Multiple Power BI data models can be created from the shared tables or views in this database.
BTW, using views is always a good idea because it provides a layer of abstraction and control and views are consumed just like tables. Never ever ever write in-line SQL queries in Power Query because it is likely to break query folding and cause queries to be very inefficient.

That data mart database… could be created by a database developer with strong SQL database design skills or it could be created using the new Power BI Datamart feature. As of this writing, this is a new feature that has some growing-up to do before we are likely to see it in common practice. But, the idea of disciplined, non-technical business users creating their own DataMart (e.g. serverless Azure SQL database) using a no-code/low-code tool is intriguing and perhaps a little scary at the same time. I think we’re all anxious to see where and how that new feature will be used as it matures.
From the perspective of Power BI development, the story might end here. If tables are in the right shape within the database, the database can be shared and used in multiple data models, there is little need to perform more transformations in Power Query.
Enterprise BI Solutions
Take a breath. It’s time to think “big picture” for bigger businesses. As Business Intelligence solution designers, we may not be particularly concerned with the data engineering and database design work that produces the tables or views used to build our BI models. But, great business solutions are not created by one team of developers who throw their work over the wall to another team, hoping that it meets everyone’s needs. Inevitably, it will not and efforts must be coordinated between developers in a properly architected solution.
Let’s back up now and look at this from the perspective of the entire organization’s data estate. Power BI, when used effectively as a enterprise reporting platform, is an essential component of an analytic data platform orchestrated to meet the needs of an organization’s business users. But, there are other components to consider in a properly governed enterprise data solution; such as a data catalog, master data management system and data prepared for operational reporting or data science analysis.
Data Platform Architectures
In large-scale data enterprise data platform solutions, data transformations should take place upstream, before the data storage layer, in data transformation pipelines or ETL packages. In a true data warehouse environment, this is often considered to be the “right answer”. However, there are costs and dependencies that are not always convenient nor feasible for a Power BI developer to manage. Data warehouse projects are often big, long-running projects. When the project has been delivered, often times the project team members are assigned elsewhere.
The following are examples of popular data warehouse and BI architectures used today in the Microsoft space:
Conventional SQL Server Data Warehouse
Way back when… we used SQL Server as a staging database to import raw copies of source data before it was transformed and loaded into the data warehouse using SQL Server Integration Services. These are software tools installed on physical on-premises servers, before most large businesses have since moved to cloud services.
Most of the heavy ETL (Extract Transform & Load) work occurred between the on-premises staging database and the SQL Server, which served as the data warehouse. In this architecture, dimensional data shaping occurs in the ETL process between the staging and DW databases.

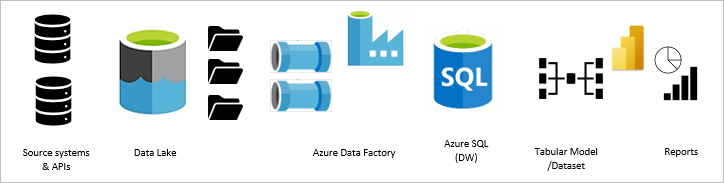
Modern Data Warehouse using Azure SQL
The modern data warehouse, in this depiction, is essentially the same architecture as the SSIS/SQL Server solution but moved to Azure services in the cloud. SSIS is replaced by the cloud-based Azure Data Factory, which serves the same purpose: to orchestrate, move and shape data. Dimensional table shaping occurs in the data pipelines between the data lake and the data warehouse database. Rather than using a relational database with expensive storage to hold raw staging data, we use a data lake to store the extracted files; which is cheap by comparison. After the initial transformation with Azure Data Factory, records are loaded into the data warehouse stored in Azure SQL. A tabular data model in Power BI imports records from those dimension and fact tables, to be visualized in Power BI reports.
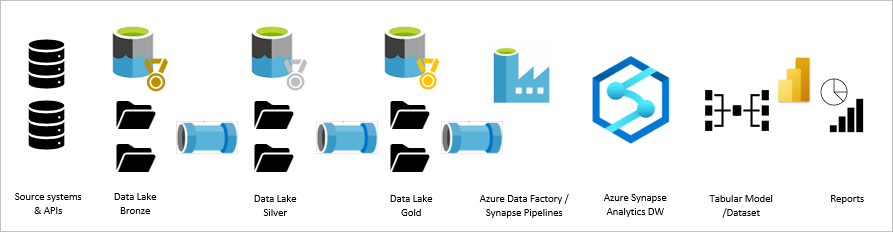
Modern Data Warehouse using Azure Synapse Analytics
Larger-scale solutions require more work and sophistication. In this example of a large modern data warehouse solution using Azure Synapse Analytics, data from many sources requires layers of cleansing and reshaping through raw, bronze, silver and gold storage areas in the data lake. The Azure Synapse database uses the SQL Server engine, enhanced with massive parallel processing and scalable service tiers to control the processing and storage cost/scale. As with the previous example, Power BI imports the dimension and fact tables into a tabular data model that leverages the dimensional structure of the data warehouse. Due to the fast query processing capabilities of the Synapse engine, certain tables in the Power BI model might implement DirectQuery to provide real-time access to changing records.
Modern Data Warehouse using Azure Databricks
The Data Bricks design approach is much the same as Azure Synapse Analytics. Data Bricks implements different technologies to provide many of the same benefits of scalability and massive, cluster-based parallel processing. Notably, Data Bricks uses the Spark query engine over file storage and a service called Delta Lake that provides a sophisticated point-in-time prospective of historical and current data records. Delta Lake and Data Bricks provide a SQL endpoint for Power BI to query data much like a relational database. Be mindful that the Data Bricks connector is newer and there is far less industry expertise using it to perform complex queries. Our experience using Data Bricks as a source so far has been good but with less experience and confidence as with Microsoft SQL based technologies.

Summary
There are architecture choices to support solutions of any size, no matter to how you measure… from 100 records to billions, and from kilobytes to terabytes. Power BI can literally handle anything with the right design and approach. The message that I hope you take away from this is that dimensional design is important no matter how big or small the project is. You can bend some of the rules but if you break them, it will bite you in the butt and you will have to redesign or even start over when the solution expands beyond a certain point – so why not do it right the first time?

Thank you Paul for this insightful perspective, this is music to my ears. Coming from a background of ETL development, DW/data marts design, Oracle BI tools, Kimball methodology, when I discovered Power BI I was thrilled by the ease of use. However I knew that beyond this apparent simplicity to just import a file and quickly design nice reports, it needed rigor in the data model design to switch form a quick mock-up solution to a robust, scalable solution. As you say it is a double-edge sword as “we” IT people want to remind our business users that we are there to properly design the model, then deliver it so they can use it to build their own reports/dashboards. However I notice even in my company that shadow projects emerge because data analysts think they don’t need IT to build Power BI reports and dashboards, and they turned to us only when problems occur (and it eventually always happen of course), requiring then to redesign the solution from scratth. That’s why I like your flowchart for the “Certified reports, certified datasets & the self-service mindset”, which can be used as an incentive for the business users to move towards properly designed data models.