Data Visualization Best Practices & Resources for Effective Communication
This article is meant to help you understand the art of data visualization and how to apply it to your work.

Image by Author
Here’s my hot take: Good data visualization is objective. It’s an art, yes, but unlike the debate about whether modern art is good or bad, which is impossible to answer, there are definitely “good” and “bad” data visualizations.
We’ve all seen a bad graph and were able to say, objectively, that graph sucks. And likewise, we’ve all seen an amazing piece of data visualization that succinctly and cleverly communicates a complicated topic.
Here’s one of my favorites, just as an example of good data viz. It’s a map of a cholera outbreak in 1854. Using this rudimentary dot chart, physician John Snow was able to see where deaths were highest and ultimately figure out what was causing the outbreak - a contaminated well. This looks simple by today’s standards, but it was positively ground-breaking in 1854.
It’s interesting, it’s rich, it invites further investigation, and it determines a trend. With no epidemiological knowledge, you can intuit what’s happening here. In other words, it’s great data viz.
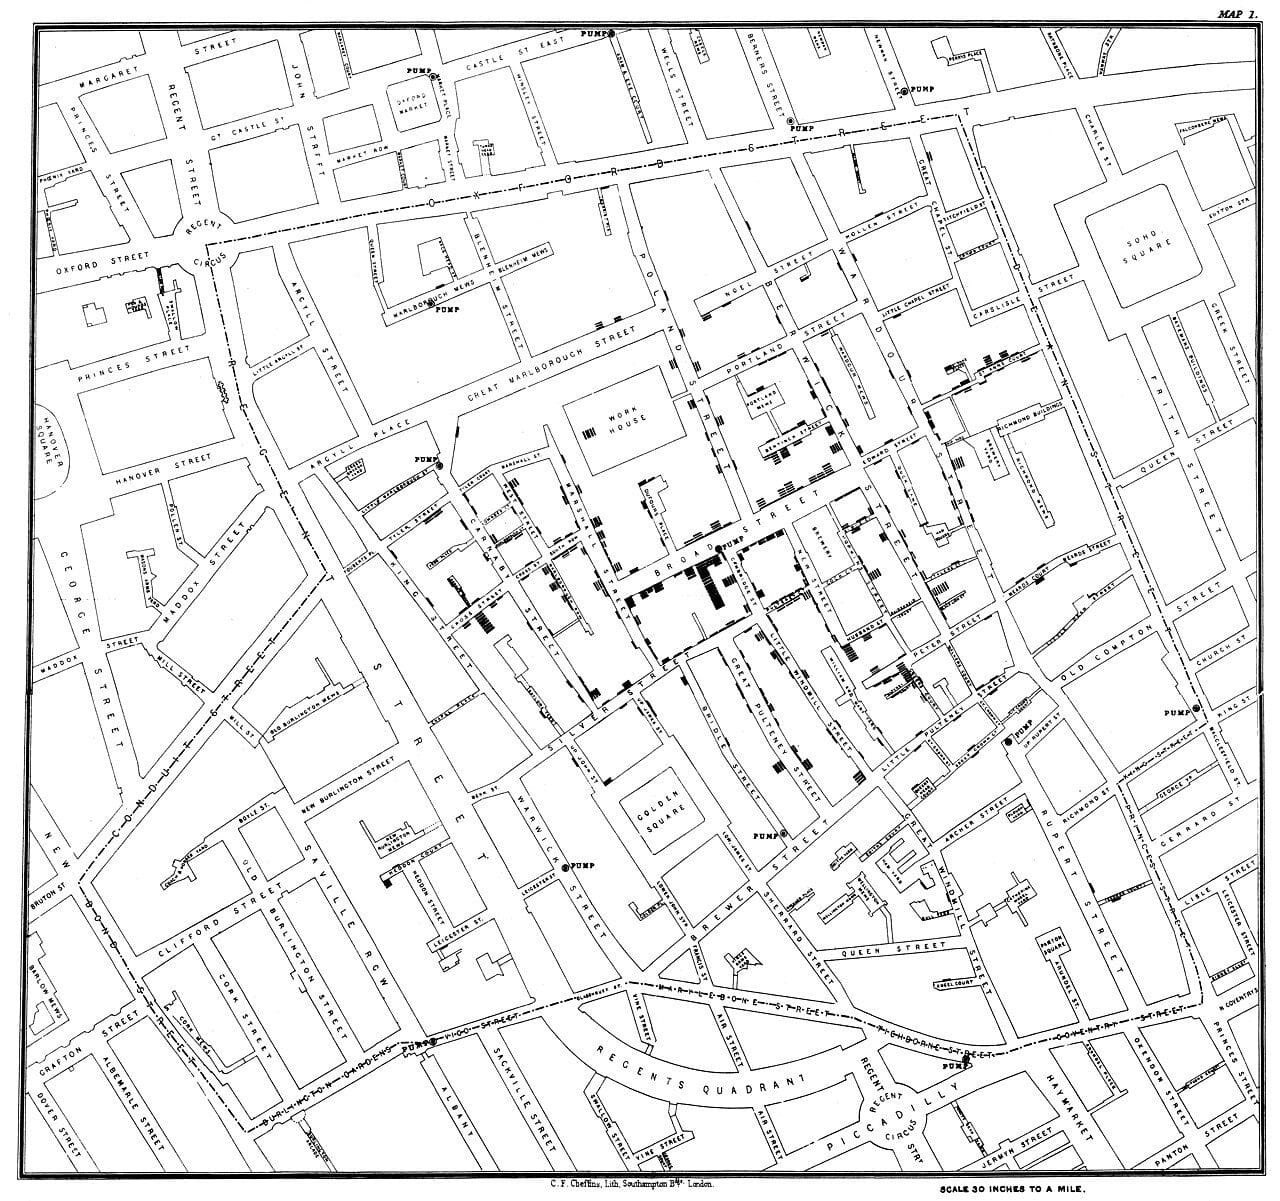
Image from Wikipedia
If you want to see a bad example, look at the graph I generated for this article, where I’m trying to figure out if people like my chart-making skills or not.
It’s bad. You have no idea what I’m trying to say; it doesn’t help spot any trends or patterns. With a single glance, you can say, “Yeah, Nate, that needs some work.”
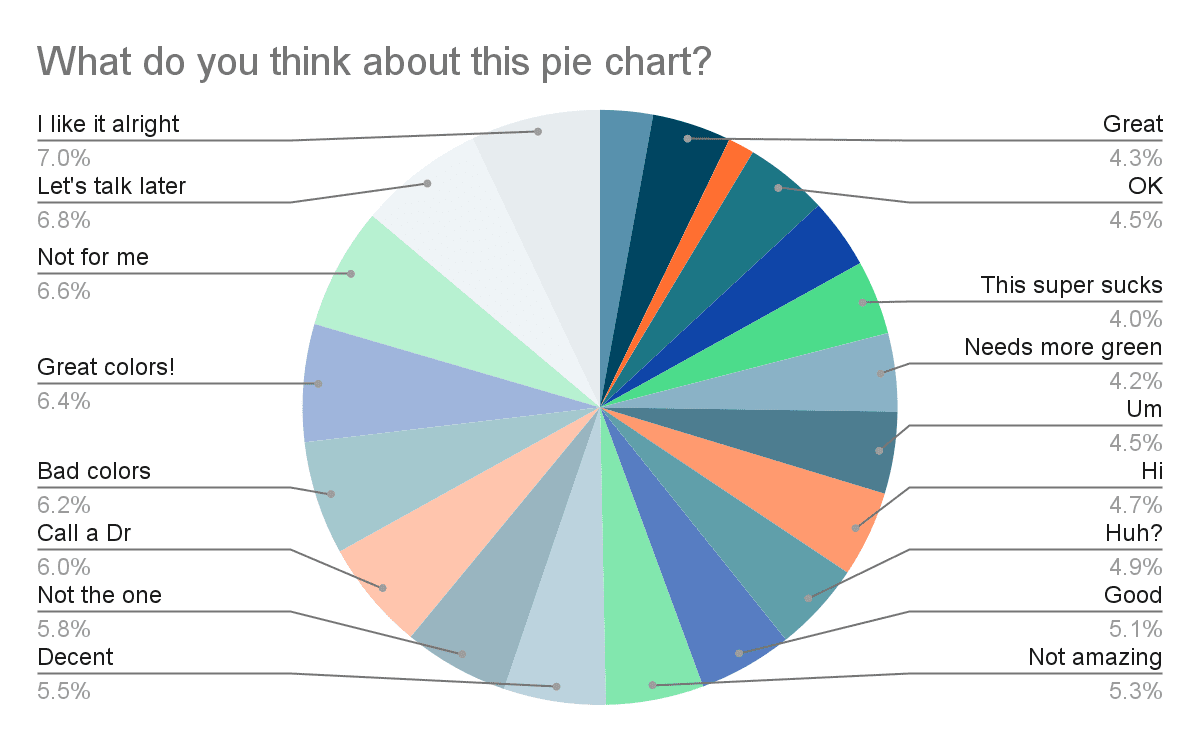
Image by Author
The good news is that because it’s an objective art, you can learn to do it well. It’s not an innate talent that you’re either born with or not – it’s a learned skill.
To help you avoid the sin of bad data viz, I’ll talk about the best practices. Though it’s a bit of an art, there is a science you can apply to the process of data visualization to make sure you’re effectively communicating.
What is Data Visualization?
Data visualization is when you make numbers tell a story. That’s my version of the definition anyway; Wikipedia somewhat more dryly defines it as “the process of designing and creating easy-to-communicate and easy-to-understand graphic or visual representation of a large amount of complex data and information.”
Any number of jobs will end up touching data visualization, since there isn’t a single job title of “data visualist,” at least not today. Data analysts, business analysts, data scientists, and even backend developers might be tasked with creating a graphic to convey some key detail.
For example, as a backend developer, you might find that your data analytics team wants you to create a visualization representing outcomes in a binary search tree. As a data scientist, you’ll be asked to turn complex finance numbers into a chart that makes sense to C-suite execs.
Data visualization is communication, plain and simple.
Why does Good Data Visualization Matters?
This is like asking why good communication matters. But let’s break it down even further. Good data visualization matters for a few different reasons.
Communicate complex information
Imagine you’re John Snow, back in 1854. Your patients are dying. You know there’s a pattern, you know it’s something to do with a particular contaminated well. You’re trying to explain this to beleaguered, skeptical city officials who don’t really believe that disease can spread this way.
Can you imagine trying to describe that cholera chart to someone? How would you do it? It’d be borderline impossible.
By contrast, non-experts can see that chart and instantly make sense of what’s happening. There’s a pattern of deaths that matches geography. Those households are the ones drawing water from that well. His chart communicated complex information at a glance. That’s one of the strengths of good data viz.
Identify patterns and trends
Let’s say you’re a data scientist working for a healthcare company. You’re trying to analyze patient data to improve care, so you’re looking at patient demographics, medical history, and treatment outcomes.
When you run a typical statistical analysis, you don’t notice any standout patterns. However, when you throw mortality and age onto a scatter plot, you realize that patients over the age of 65 have a sharply increased mortality rate.
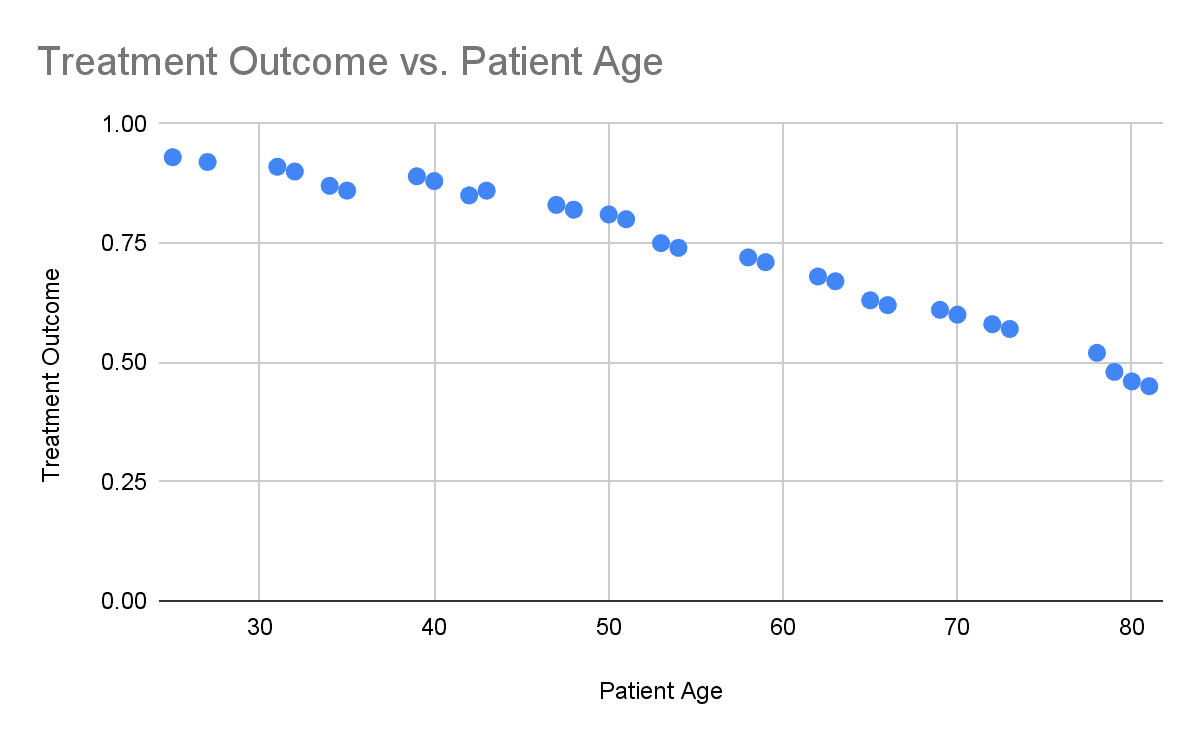
Image by Author
Now you can pass those findings on to healthcare practitioners so they can investigate ways of reversing that trend.
What are the best Practices for doing Good Data Visualization?
OK, now you understand what good data viz is and why it matters. Let’s get into the data visualization best practices you can apply to make sure you create stunning, memorable, compelling graphs and charts.
Know your audience
This is the most important step. Who are you creating this data visualization for? What are they interested in? What kind of basic understanding do they already have? What do they need this data viz for?
For example, imagine you’re a data analyst trying to explain to the CTO how effective an email marketing campaign is for various segments of the brand’s audience. The outcome of this meeting will determine the entire email marketing strategy for the next quarter.
But you’ve forgotten that what’s second nature to you – CTRs and CTAs and segments named things like “Segment A” are not easily parsed by non-experts.
You present the following atrocity and have to spend the entire meeting re-communicating what exactly all that jargon and segment names mean. The CTO is confused, unsatisfied, and unable to make a decision.
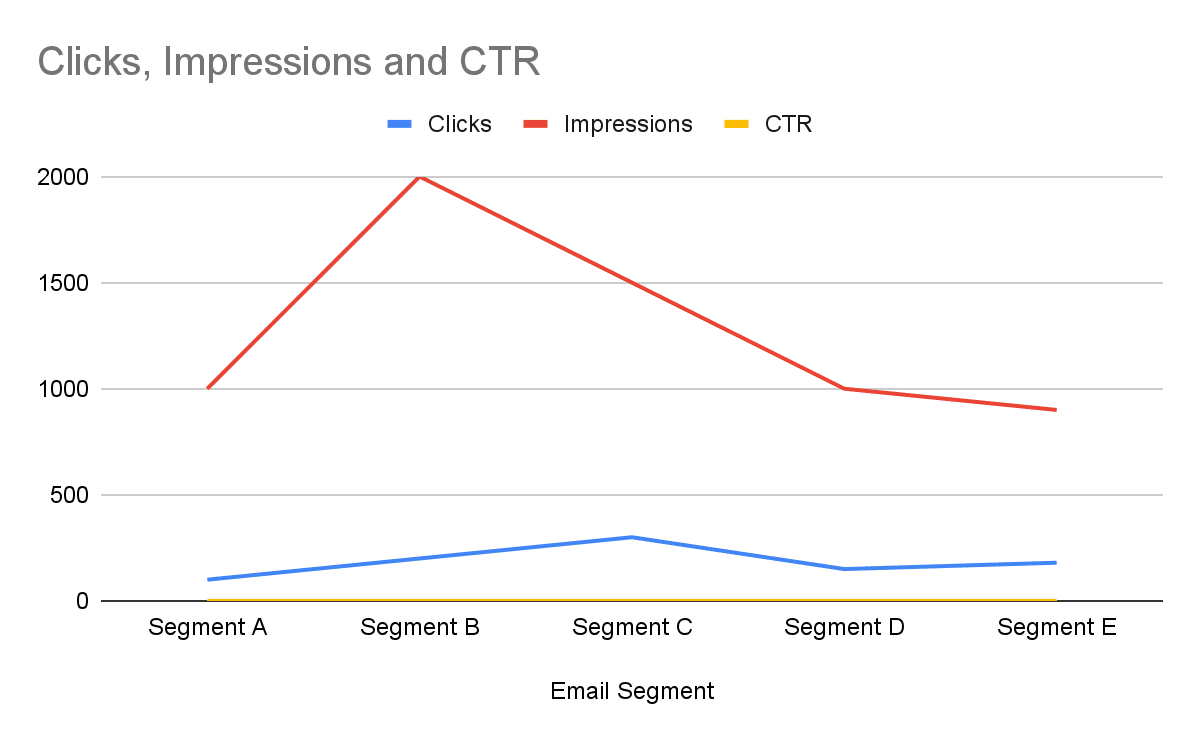
Image by Author
Instead, you should streamline this to the main key component that decision-makers need to make a decision on and make sure that everything makes sense to that audience. Here’s what a good version of that data visualization could look like:
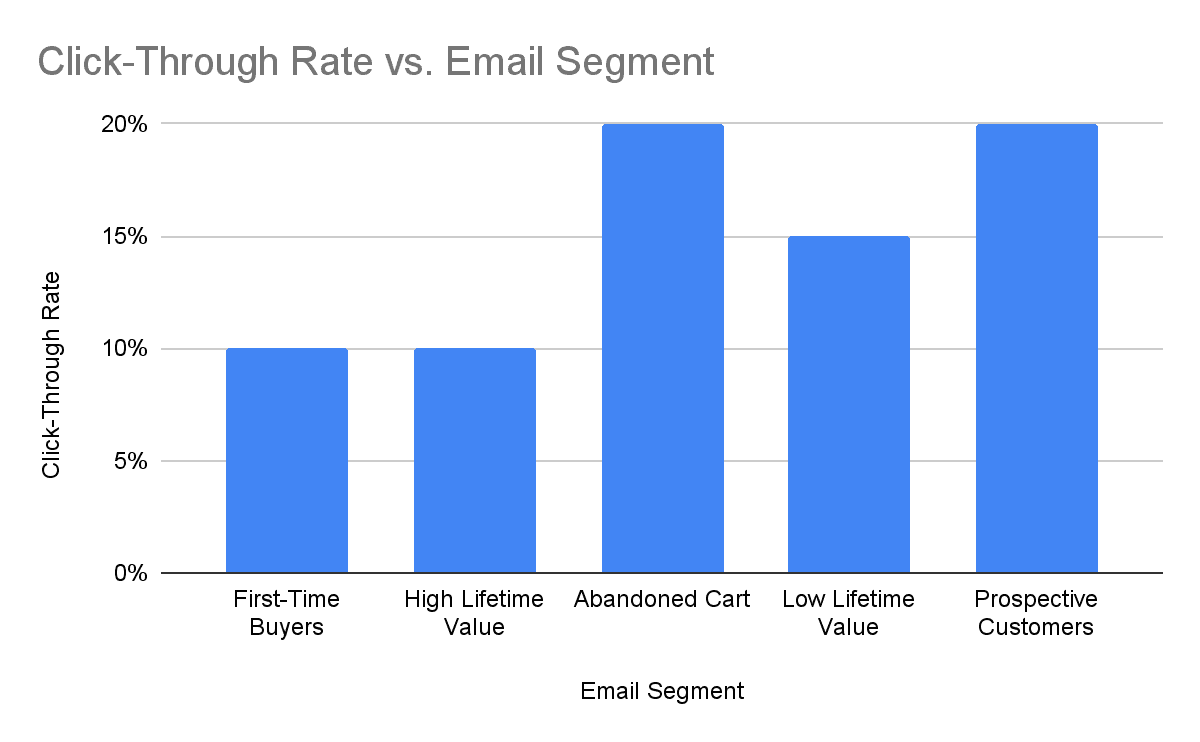
Image by Author
The audience can clearly understand the data and make a decision.
Keep it simple
You know how, when you watch Star Wars nowadays, it feels a little bit like filmmakers recently discovered all the PowerPoint transitions they could use, and used every single one just because of the fun and novelty?
That’s bad data viz practice. A good data viz practice is to keep things as simple as possible.
For example, a few years ago there was this big trend of doing 3D charts. It didn’t add anything to the information being conveyed. But it was fancy, so people loved it.
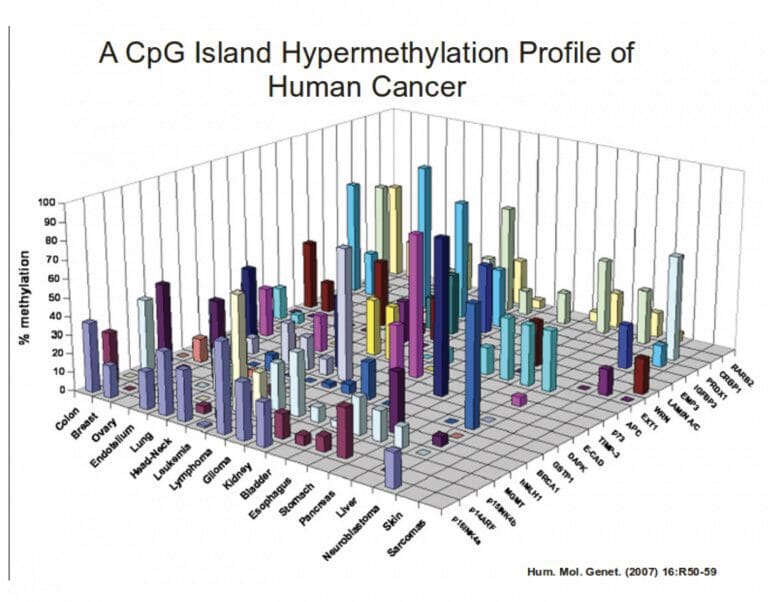
Image from Semantic Scholar
Good data viz means you keep the focus on the data. Don’t make it interactive if it doesn’t need to be interactive. Don’t add more colors than you really need. If you can get away with removing extra legends by making titles self-explanatory, all the better.
Choose the right chart type
Let’s say you want to show change over time. What is the best type of chart?
Your answer to that question can mean the difference between a good, clean bit of data visualization, and a monstrosity that shouldn’t see the light of day.
For the record, the right answer is a line chart. Have time on the x-axis, and whatever other factor you’re measuring on the y-axis.
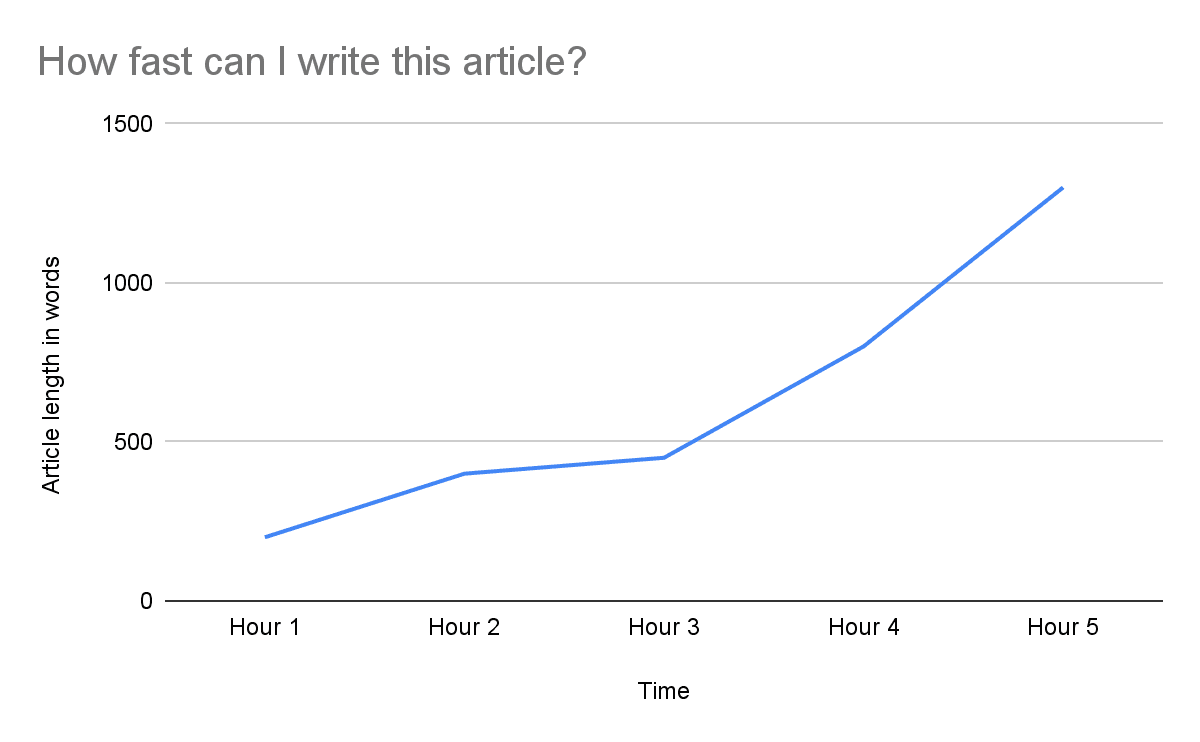
Image by Author
Go back to my hideous pie chart from earlier. You can clearly see this is the wrong type of data visualization for the answer I’m trying to get. A pie chart indicates a wholeness of some kind; it’s great for adding up percentages. So if 55% of my employees think the chart is great, but 45% don’t, then a pie chart is good to convey that finding.
But for a mishmash of open text box answers? A pie chart is worse than useless.
Here is a nice table to show you, as a rough rule of thumb, which types of data viz are right to use when. Remember, you’re the expert on your own data, so take this with a pinch of salt.
| Line charts | Trends over time |
| Bar charts | Comparing values between groups |
| Pie charts | Show the proportion of different groups |
| Scatter plots | Relationship between two variables |
| Heat maps | Visualize data in a matrix format |
| Tree maps | Hierarchical data |
I also encourage you to peruse data viz and make note of what you like and don’t like. Remember, data viz is objective. You can, with some thought, put your finger on what’s working and what isn’t, and take those findings for your own data visualizations.
Provide context
Finally, you should always explain the why behind your data visualizations. What are the data units? What does the data represent? What other relevant information is needed to make your case?
Look at this example for what not to do:
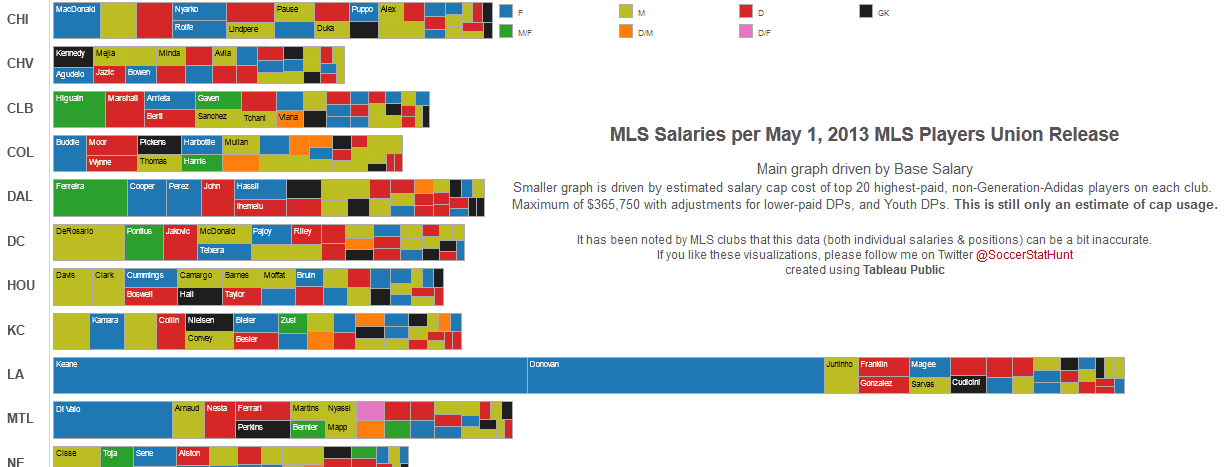
Image from Tableau
It’s overly complex, which already violates our second Good Data Viz commandment. But it also doesn’t give any context. What takeaway am I supposed to have here? What do those letters mean? Why are those rectangles not to scale?
If you need to provide definitions, throw them in. If you think an industry benchmark will better illustrate the significance of your findings, add it. And most importantly, remember you’re telling a story. If you just wanted to provide numbers, you could give people a table. But you’re not. You’re shaping the narrative. That’s why context matters so much.
Remember, you’re the expert on these numbers. You’re communicating an idea. You need to provide any supplementary material you think will help you make your case best.
Resources to Learn more about Data Visualization
There are two ways to learn more about data viz: learning and doing. Let’s go through both types.
Read/watch/consume content about data viz
First, you should ground yourself in data visualization basics. I recommend the following resources:
- I love David McCandless’s YouTube lecture on the beauty of data viz as a starting point.
- Greg Martin’s intro to Data Viz is also a really nice video to get your feet wet.
- Simplilearn has a bite-size tutorial of just 27 minutes on YouTube.
- IBM’s Data Visualization with Python Course is a good next step, hosted by Coursera. It’s free.
DIY style
Once you’re done listening, watching, and learning, it’s time to apply what you know. Get reputable data from sources like:
- Statista
- Tidy Tuesdays GitHub
- Your own life - what you eat, how you spend your time, your mood, your career applications, anything!
Then, try to make data visualizations yourself. Consider the data and think about what questions you have, what trends you’d like to spot, and what’s confusing and could be made clearer.
You can use platforms like The Pudding or Kaggle to get inspiration for what kinds of questions you can ask or answer.
I also recommend checking out what real-life interviewers are asking in data science interviews. Platforms like StrataScratch help you practice your data viz skills on real-world examples.
Want more? The 30 Resources for Mastering Data Visualization is a great best-of list of resources all about data visualization.
The best Practices for Good Data viz Communication
There’s that classic quote: “A picture is worth a thousand words.” If that’s true, then good data visualization is a library’s worth of words.
Good data visualization is the backbone of almost any meaningful decision that gets made at any company. It’s what helps people from different departments communicate in a way that makes sense to all parties. It’s how you take a mess of numbers and make them tell a story.
But it’s easy to get wrong. To do data visualization the right way, remember you need to keep your audience in mind, keep things as simple as possible, choose the right type of chart, and always provide context.
Hopefully, this illustrated guide has helped you to better understand what good data viz is, and how you can make the best data visualizations moving forward.
Nate Rosidi is a data scientist and in product strategy. He's also an adjunct professor teaching analytics, and is the founder of StrataScratch, a platform helping data scientists prepare for their interviews with real interview questions from top companies. Connect with him on Twitter: StrataScratch or LinkedIn.