


Automatic Version Control for Data Scientists
How can you keep your machine learning models and data organized so you can collaborate effectively? Discover this new tool set available for better version control designed for the data scientist workflow.
One of the best parts of Data Science is the adventure of going through a full project, end-to-end. Starting from data cleaning, to visualisation, to feature building, and finally, training a machine learning model. The skills of a great Data Scientist are in high demand, commanding excellent salaries.
A major challenge in all of this is organisation.
These days, Data Scientists are working in small teams of a least a few members each. Every one of them is playing around with the same data, building on the work of each other.

The many different components of great Data Science.
Unfortunately, Data Science team members often work in their own mini silos. They create their own codebase, run their own Jupyter Notebooks, and display their own visualisations. Somehow, they hastily mash it all together to create the final report. It’s a less than stellar coordination, to say the least.
But there must be a better way. Some sort of system or tooling that allows someone who works extensively with data and graphing, a data scientist, to efficiently work with the rest of their team, building on each other’s work. That system needs to be flexible, easy to use, and something that doesn’t interrupt the Data Science workflow.
Let’s see what we can do…
How git can work for Data Science
In a regular old software engineering team, Git is a commonly used tool for organizing code, projects, and team collaboration. Team members work on their own local code, but always sync up their progress and new developments with a central repository.
This ensures that everyone is up to date and in sync. It’s a great way of having the work of the team compound on each other, rather than conflicting, which leads to higher output.
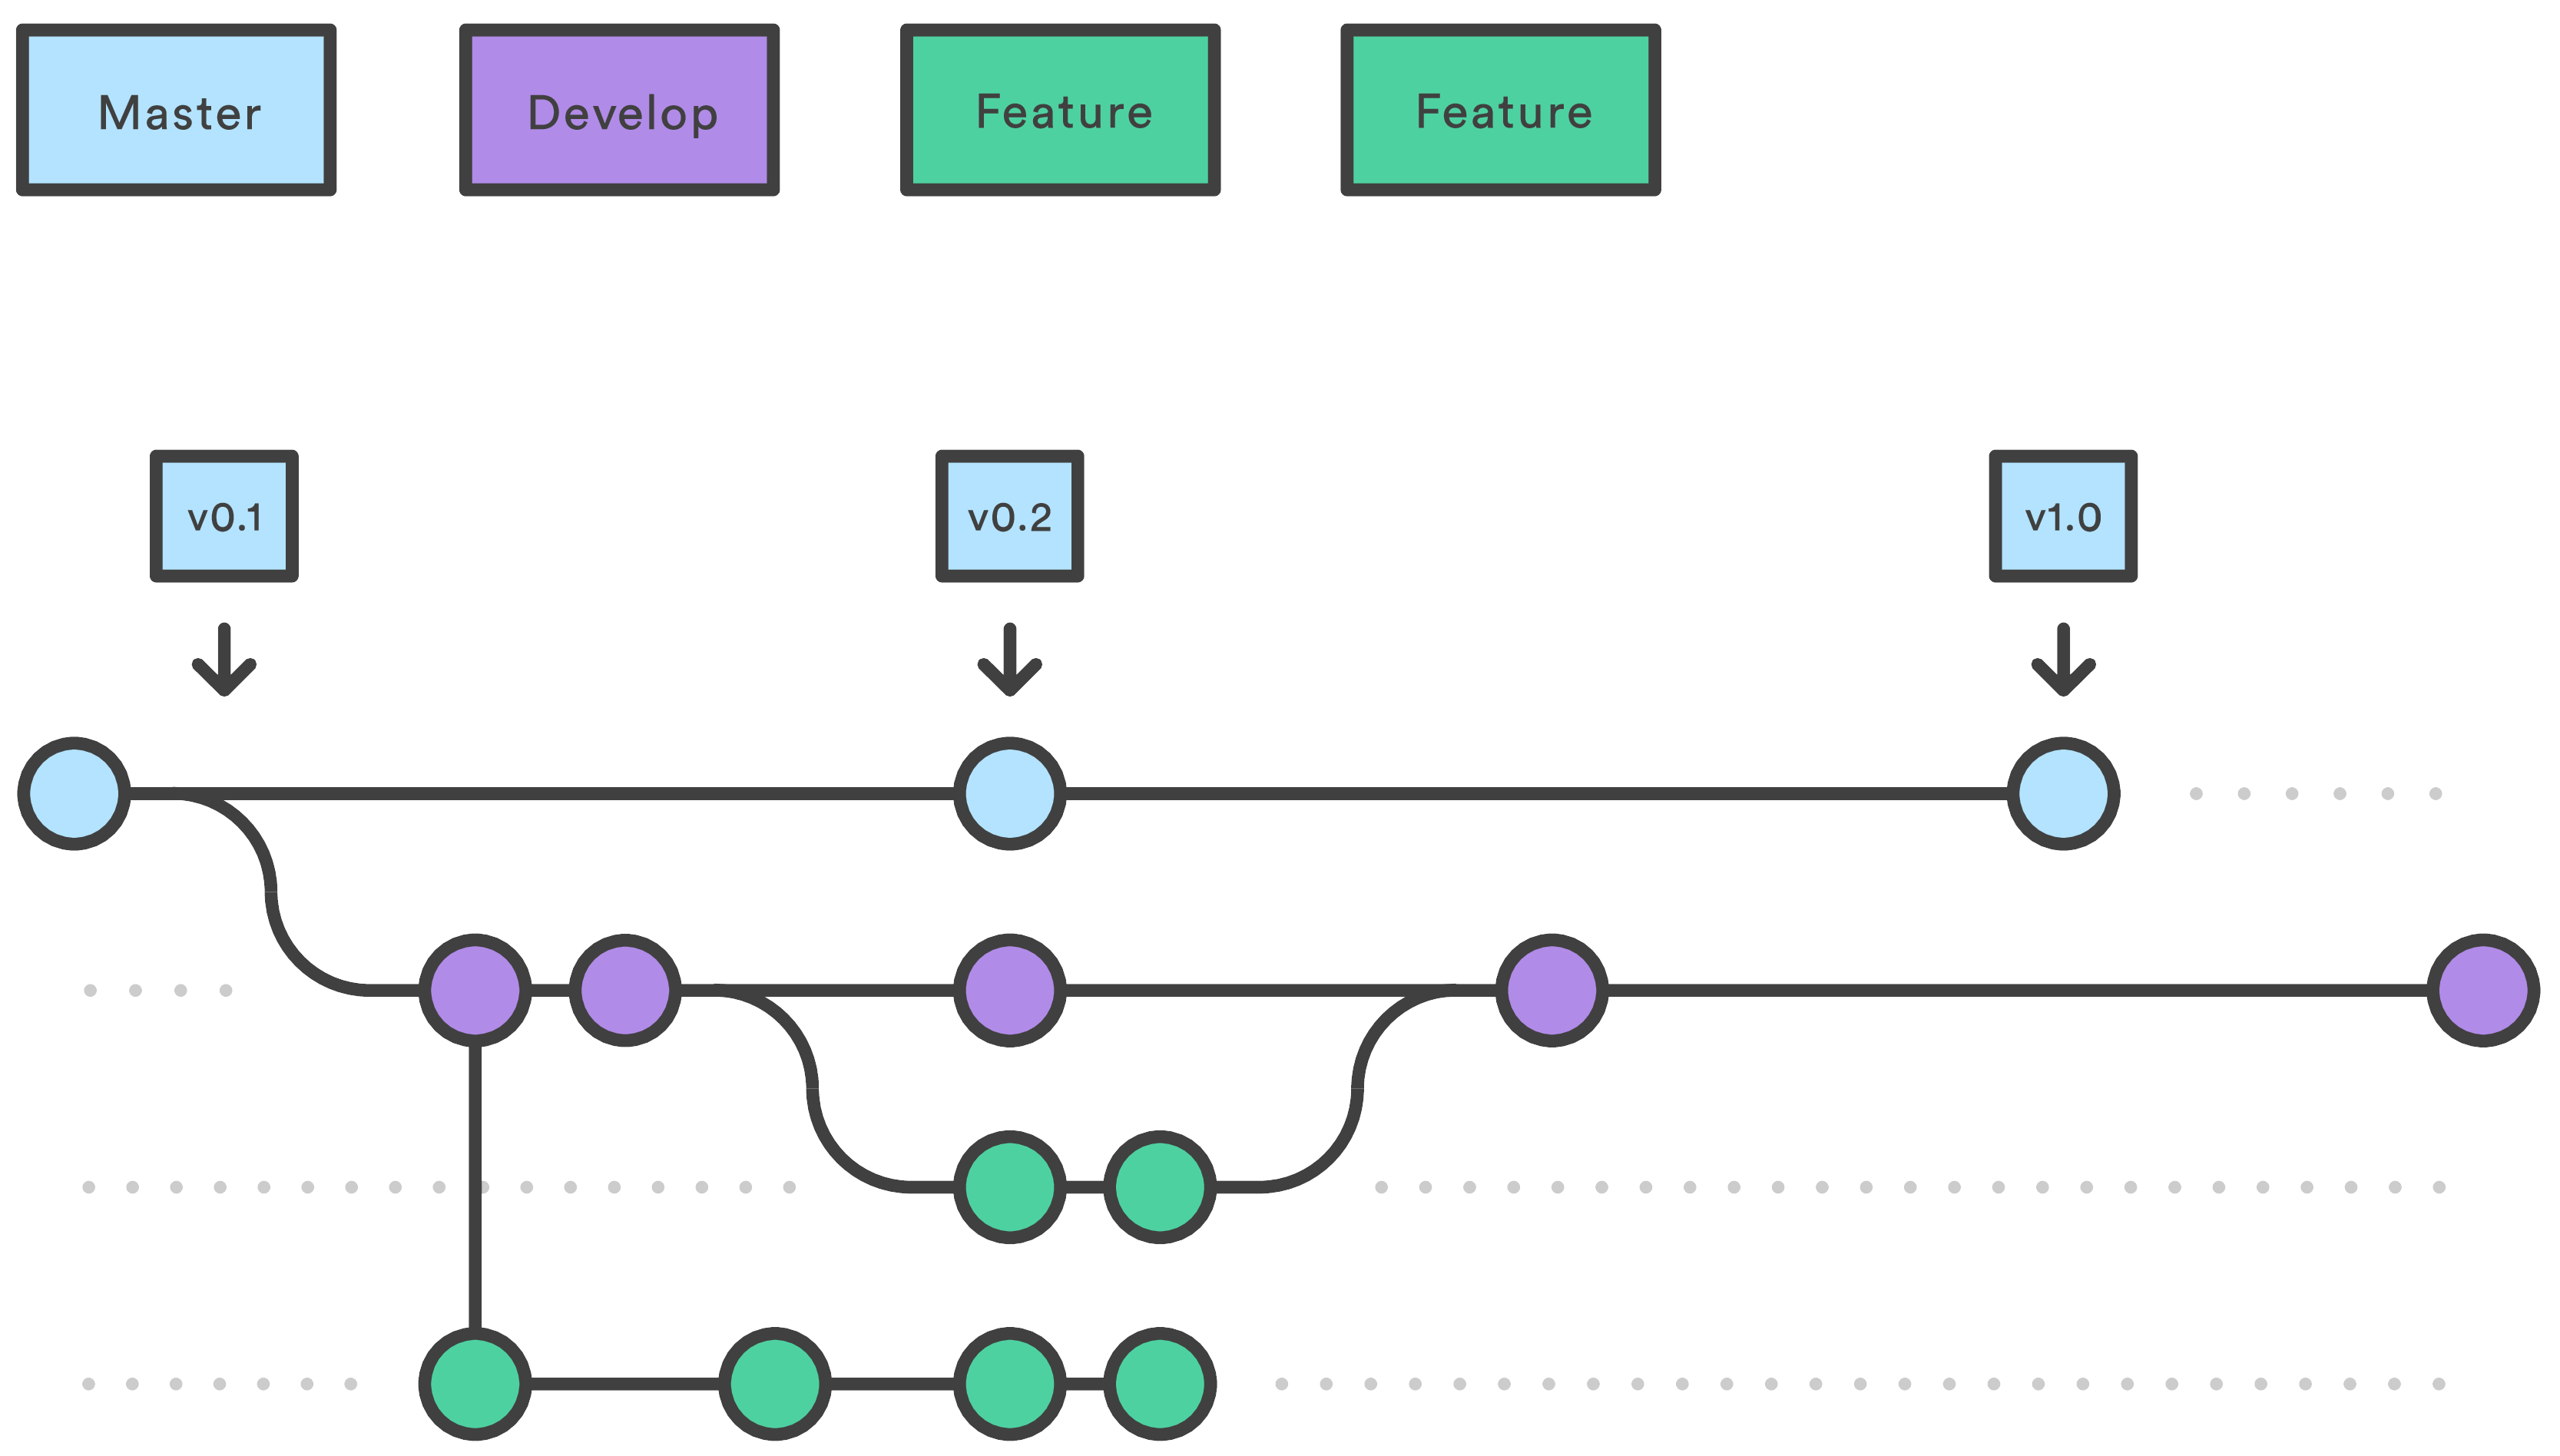
Git flow. Team members work on their own “Feature” branches which are then all synced up in the “Develop” branch. Once the Develop branch is nice and polished, the production version of the code is synced up with Master.
Data science is a bit trickier because a lot of it is a combination of research and software engineering:
- The data itself is large, so shared storage of it can be challenging. Git-LFS helps but is pretty slow to use.
- Much of the time, the code changes are minor, but the visualisations look completely different. Git doesn’t allow the ability to show changes in graphs from commit to commit
- Data Scientists commonly work with Jupyter Notebooks. Visualising the changes in the notebooks on GitHub is terrible. It shows the difference in the .ipynb file, but not the actual code on graphs that we find useful in the notebook.
With all of that said, we can start to get an idea of what a good version control system for Data Science should look like.
First off, we’re looking for ease of use. DevOps and Backend engineers may be very skilled with git, but Data Science tends to be more on the research side than engineering. Dealing with code conflicts should be especially smooth.
We’re also going to want to see what the actual changes are in the data science project. Seeing code changes is fine, but it doesn’t tell the full story. That’s especially true if the team is using Jupyter Notebooks where visually, the code is far too complicated to tell us much about how some of the graphs or data manipulation has changed.
Lastly, a central data storage or working platform can be extremely helpful. Without a central storage, data scientists would always have to be downloading and preparing their own copies of the data — highly inefficient for large datasets.
With these in mind, we can now investigate a solution
A platform for using Git in Data Science
One great option for getting a version control system in place for Data Science is the Saturn Cloud platform. With it, multiple Data Scientists can work on the same Jupyter Notebook, with the same dataset, yet running on their own machines.
Data Science Collaboration
To get started, we’ll create our own hosted Jupyter Notebook, which anyone with a link can access. After creating an account, the video below shows you how it’s done.
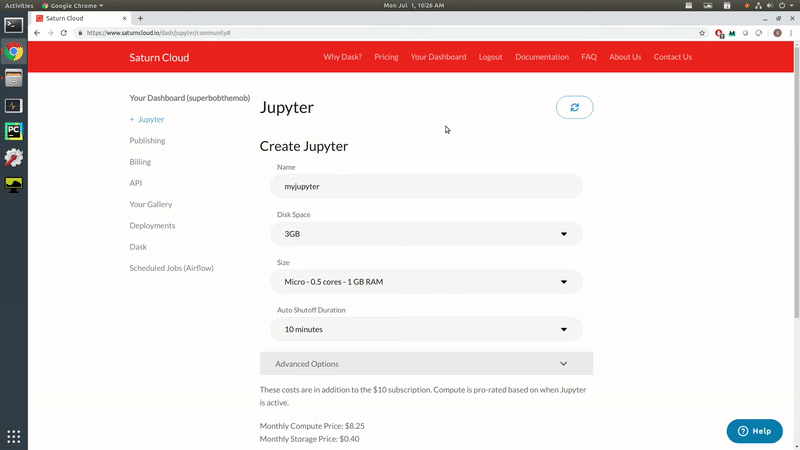
Creating a hosted Jupyter Notebook.
Once we have that up and running, we can go ahead and start up our Jupyter Lab. Once opened, you should see your project folder already setup.
For this experiment, we’re going to be using the 2018 Kaggle ML and DS Survey dataset. The dataset consists of over 23,000 multiple choice answers to a set of questions posed to Data Scientists and Machine Learning practitioners regarding the compensation.
A few interesting facts from the dataset:
- “Data Scientist” had the highest compensation, higher than “Data Engineer” and “Research Scientist.”
- Technology companies pay the most, followed by Marketing and Finance.
- More experience and higher education increases pay.
- Compensation is highest in the US, followed by Switzerland and Australia.
You can check out the full Jupyter Notebook for the Data Science compensation here.
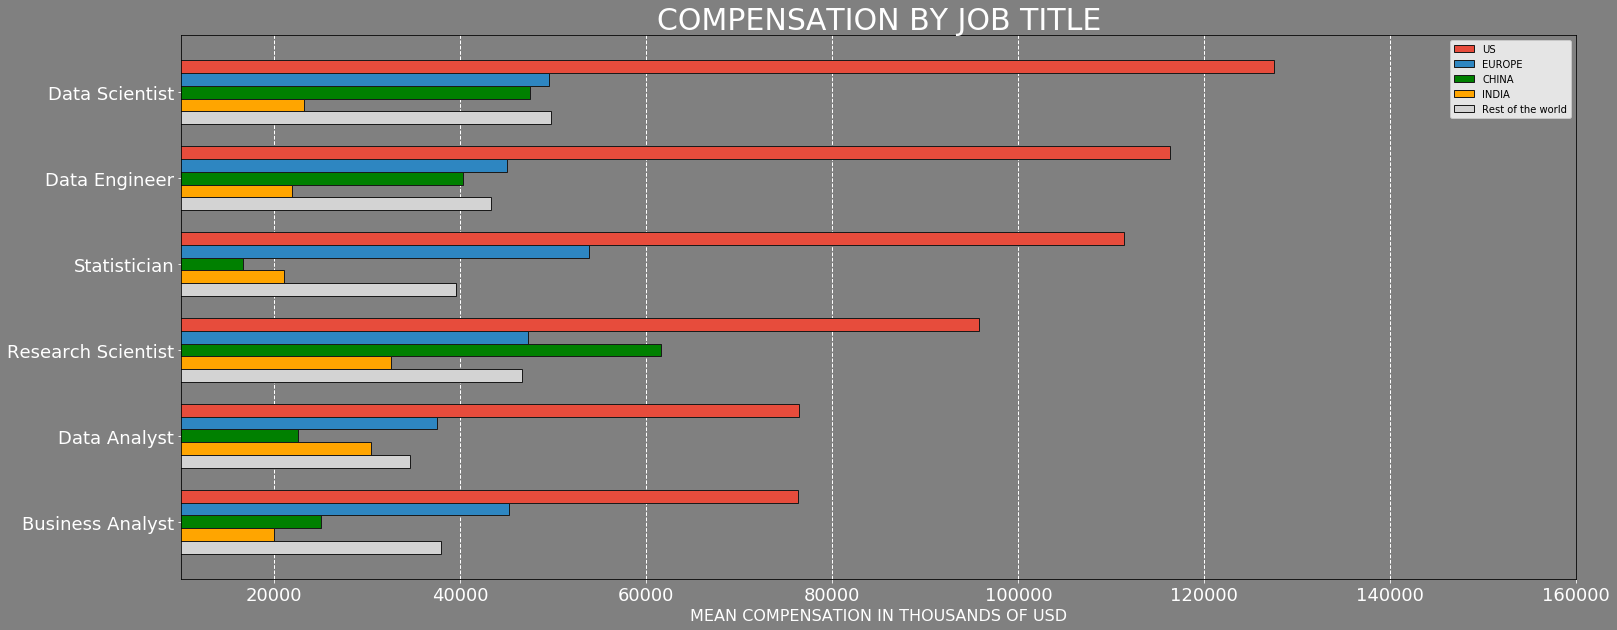
Data Scientist compensation.
To get started with the team collaboration, go to your Dashboard and click on the Collaborators link. In it, you’ll find the ability to add collaborators to your project by Saturn Cloud username.
Adding a user to your project sends them a personal email inviting them to collaborate on the project. Once they accept the invitation, their own cloud instance will be created with the exact same settings, libraries, and software.
The user (Data Scientist) instantly gets access to their own version of the project’s Jupyter Notebooks and datasets. This allows for multiple Data Scientists to be working in identical environments, with identical data, and an identical starting point for their notebooks!

Collaboration for Data Scientists.
Data Science Version Control
Now we can get into Saturn Cloud’s version control system.
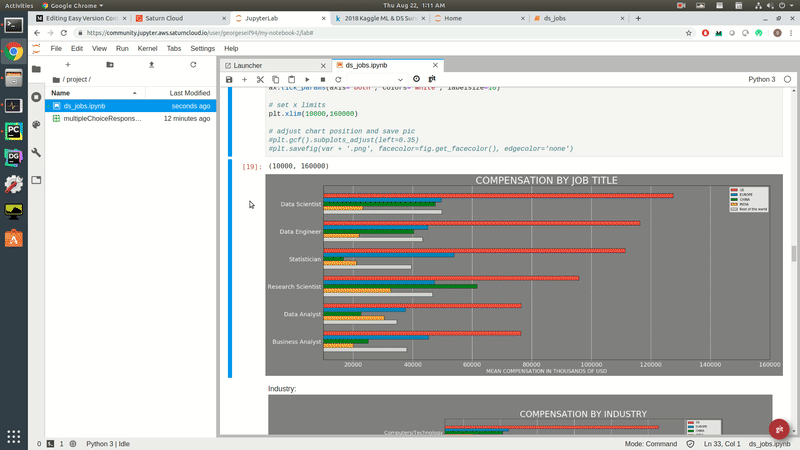
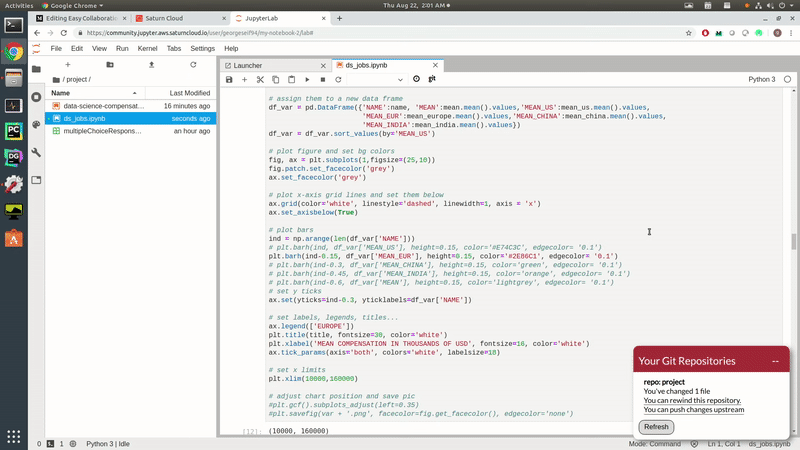
Once you open up the Jupyter Lab on your instance, you’ll see your working interface. On the left-hand side of your screen, there’s a project folder. Any Jupyter Notebooks which are created and saved in that project folder will automatically have version control enabled. I’ve placed my ds_jobs.ipynb Notebook into the project folder to enable version control on it.
To showcase how the version control works, we’re going to modify some of the data visualisations. We’ll pretend we’re only interested in data from European countries and filter out everything else. Once the visualisation is changed, we’ll be able to push our changes to a remote git repository. The 45-second video down below shows exactly how that’s done!
Data Science Version Control.
Great!
We were able to make some quick and easy modifications to our Jupyter Notebook. That Notebook is accessible to all project collaborators (Data Scientists). So whenever they log on, they’ll be able to see that you’ve made a change and optionally pull those changes so they can stay up to date!
Data Science on Demand — Rewinding
Another awesome feature here is the rewind function. It works similarly to a git reset that basically reverts our changes so we can go back to an earlier state. This is super useful if you feel like you’ve made a mistake and want to roll back or just want to see what things looked like before.
Let’s say we want to rollback to our visualisation with all the regions shown for data science compensation. We’ll again click on the git button in the bottom right. This time, click on the you can rewind this repository link. A slider pops up where you can select the time you wish to roll back to. Once set, you’ll be able to see your old code and graphs!
Rewinding Jupyter Notebooks.
Now that’s control!
Original. Reposted with permission.
Related: