Data & Reality
Data is an abstract representation of reality. We take real things, processes, and actions and turn them into numbers.
This is useful for analysis. However, it creates a conceptual disconnect from the reality you are interested in explaining. Take these numbers for example:
56,000 people.
840,000 square miles.
Those are the population and size of Greenland. Alone, those numbers are a little hard to conceptualize. Are they big or small? How do they relate?
The graphic below (by UCI) delivers far greater impact:
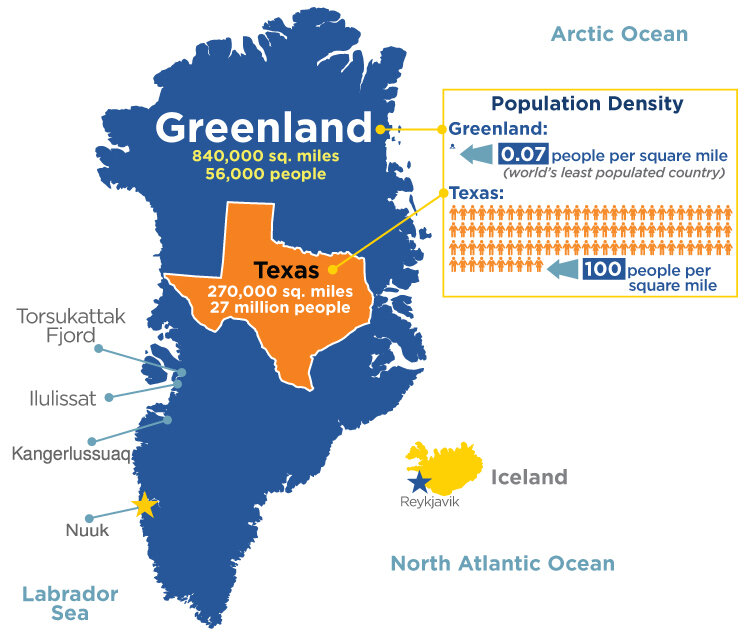
By making the data relatable (as above) or re-connecting it to reality with examples, you have the opportunity to help your audience and deliver a more compelling data story.
In the following interactive Juicebox learning app, we share examples of making data relatable and specific. This is the special sauce that separates data storytelling from traditional dashboards and reports. Looking for more lessons on data storytelling? We’ve got you covered with our collection of data storytelling lessons.