Stock Price Prediction and Forecasting using Stacked LSTM.
This article was published as a part of the Data Science Blogathon
Introduction
Table of Contents:
- Loading the Data
- Train and Test Split
- Data Preprocessing
- LSTM
- Prediction
- Conclusion
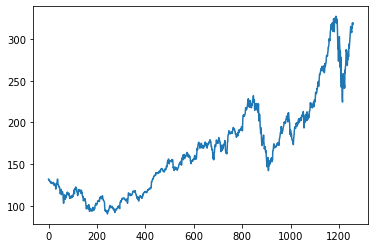
Loading the Data
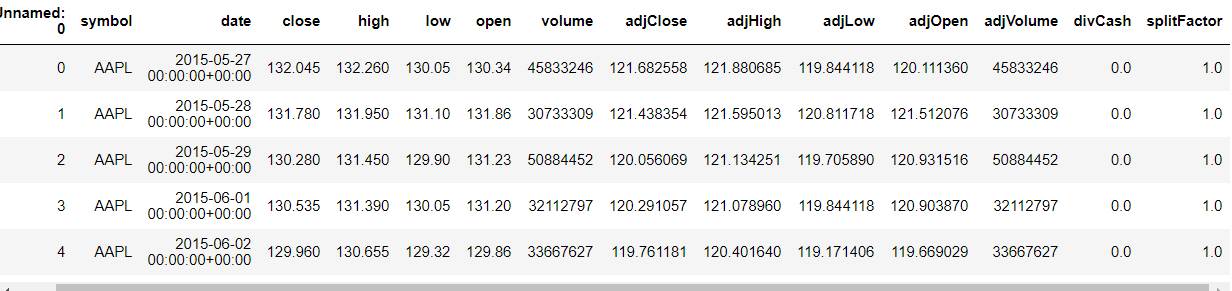
df1=df.reset_index()['close']
Now get into the Solution:
LSTM is very sensitive to the scale of the data, Here the scale of the Close value is in a kind of scale, we should always try to transform the value.
Here we will use min-max scalar to transform the values from 0 to 1.We should reshape so that we can use fit transform.
Code:
from sklearn.preprocessing import MinMaxScaler
scaler=MinMaxScaler(feature_range=(0,1))
df1=scaler.fit_transform(np.array(df1).reshape(-1,1))
Train and Test Split
Whenever training Timeseries data we should divide the data differently we should train the data with the respective date.
Always remember that in time-series data the one data is dependent on other data. The training size should be 65% of the total length of the data frame, the test size should be the difference between the length of the dataset and the training size.
Code:
training_size=int(len(df1)*0.65)
test_size=len(df1)-training_size
train_data,test_data=df1[0:training_size,:],df1[training_size:len(df1),:1]
Train data and Test data is ready.
Data Preprocessing
Now consider the time steps, if I want to predict the price of the stock in a day that how previous data should be considered.
Now the timestep value will be 100. Let’s split the data X, Y. In the 0th iteration the first 100 elements goes as your first record and the 101 elements will be put up in the X. The 100 elements will be put up in the Y.
Code:
import numpy
def create_dataset(dataset, time_step=1):
dataX, dataY = [], []
for i in range(len(dataset)-time_step-1):
a = dataset[i:(i+time_step), 0]
dataX.append(a)
dataY.append(dataset[i + time_step, 0])
return numpy.array(dataX), numpy.array(dataY)
time_step = 100
X_train, y_train = create_dataset(train_data, time_step)
X_test, ytest = create_dataset(test_data, time_step)
LSTM
- The input gate: The input gate adds information to the cell state,
- The forget gate: It removes the information that is no longer required by the model,
- The output gate: Output Gate at LSTM selects the information to be shown as output.
While Implementing any LSTM, we should always reshape our X train in 3-D, add 1 the reason behind is the time step and the 1 is given to the LSTM.
Code:
X_train =X_train.reshape(X_train.shape[0],X_train.shape[1] , 1)
X_test = X_test.reshape(X_test.shape[0],X_test.shape[1] , 1)
Then import required modules for the stacked LSTM.
Code:
from tensorflow.keras.models import Sequential
from tensorflow.keras.layers import Dense
from tensorflow.keras.layers import LSTM
We will be using a sequential model and adding the layers of the LSTM as said, in the above sentence. The first layer should be the time step in 1.
Code:
model=Sequential()
model.add(LSTM(50,return_sequences=True,input_shape=(100,1)))
model.add(LSTM(50,return_sequences=True))
model.add(LSTM(50))
model.add(Dense(1))
model.compile(loss='mean_squared_error',optimizer='adam')
Let’s see the summary.
Now the final part is to fit the X_train and the y_train.
Prediction
Predict both the X_train and the X_test, now let’s scaler inverse transform because I want to see the root mean square performance.
Code:
train_predict=model.predict(X_train)
test_predict=model.predict(X_test)
train_predict=scaler.inverse_transform(train_predict)
test_predict=scaler.inverse_transform(test_predict)
Code:
import math
from sklearn.metrics import mean_squared_error
math.sqrt(mean_squared_error(y_train,train_predict))
Here the time step is 100, Whatever the values in train predict and test predict. I got I am just plotting it don’t forget we have to inverse the scaler transform.
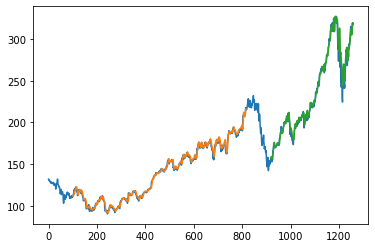
- Green indicates the Predicted Data
- Blue indicates the Complete Data
- Orange indicates the Train Data
If I consider the last date in the test data as of 22-05-2020, I want to predict the output of 23-05-2020. We need the previous 100 data for that I am taking the data and reshaping it.
Code:
x_input=test_data[341:].reshape(1,-1)
x_input.shape
So, you can predict the prices of preferred stocks using this strategy.
Inference:
Conclusion:
In this article we have seen how to predict a stock price, this is a simple algorithm. You can make use of auto-ml so that the adding of new data will be easy. Refer a lot of Deep Learning Algorithms, Machine Learning … etc.
Thanks for spending your timing in reading the article.
The media shown in this article are not owned by Analytics Vidhya and is used at the Author’s discretion.


I think you have a leak in the data scaling you should scale the training and testing data seperatly