
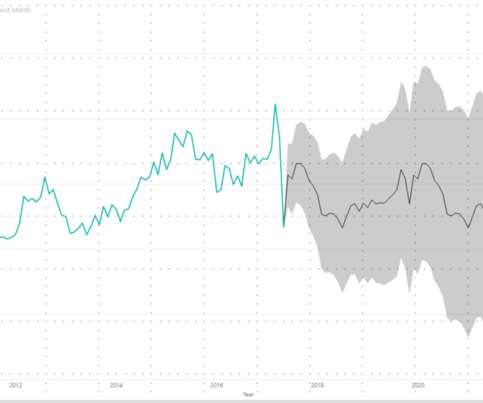
Time Series Forecasting using Microsoft Power BI
Analytics Vidhya
JULY 9, 2020
Introduction Time series forecasting is a really important area of Machine Learning as it gives you the ability to “see” ahead of time and. The post Time Series Forecasting using Microsoft Power BI appeared first on Analytics Vidhya.


Let's personalize your content