


If you want more people to use data in their day-to-day work, it needs to be easy. This is true no matter what their job — marketer, supply chain manager, engineer, etc. That means putting data, analytics, or even AI into a format that is accessible and actionable for the end user.
In this blog post, we’ll discuss the range of different tools and outputs that make data consumable for business experts. Plus, you’ll see how Dataiku makes it easy to develop and deliver all of these applications.
Bring Dashboards Into the Age of AI
Dashboards have been around in the world of business intelligence (BI) for decades — some say as early as the 1980s. And they’ve stayed around for a reason: Business people know them and use them for better business decisions.
Some have ceremoniously declared the “death of the dashboard” given the increasing volume and complexity of data. However, we believe these statements are overblown. The reality is that dashboards and data visualizations are still very much a key deliverable. They allow business teams to understand data teams’ work and conclusions.
However, it is true that with more advanced analytics and AI, dashboards can (and should) become more sophisticated. Gone are the days where a static dashboard updated weekly with historical data will suffice.
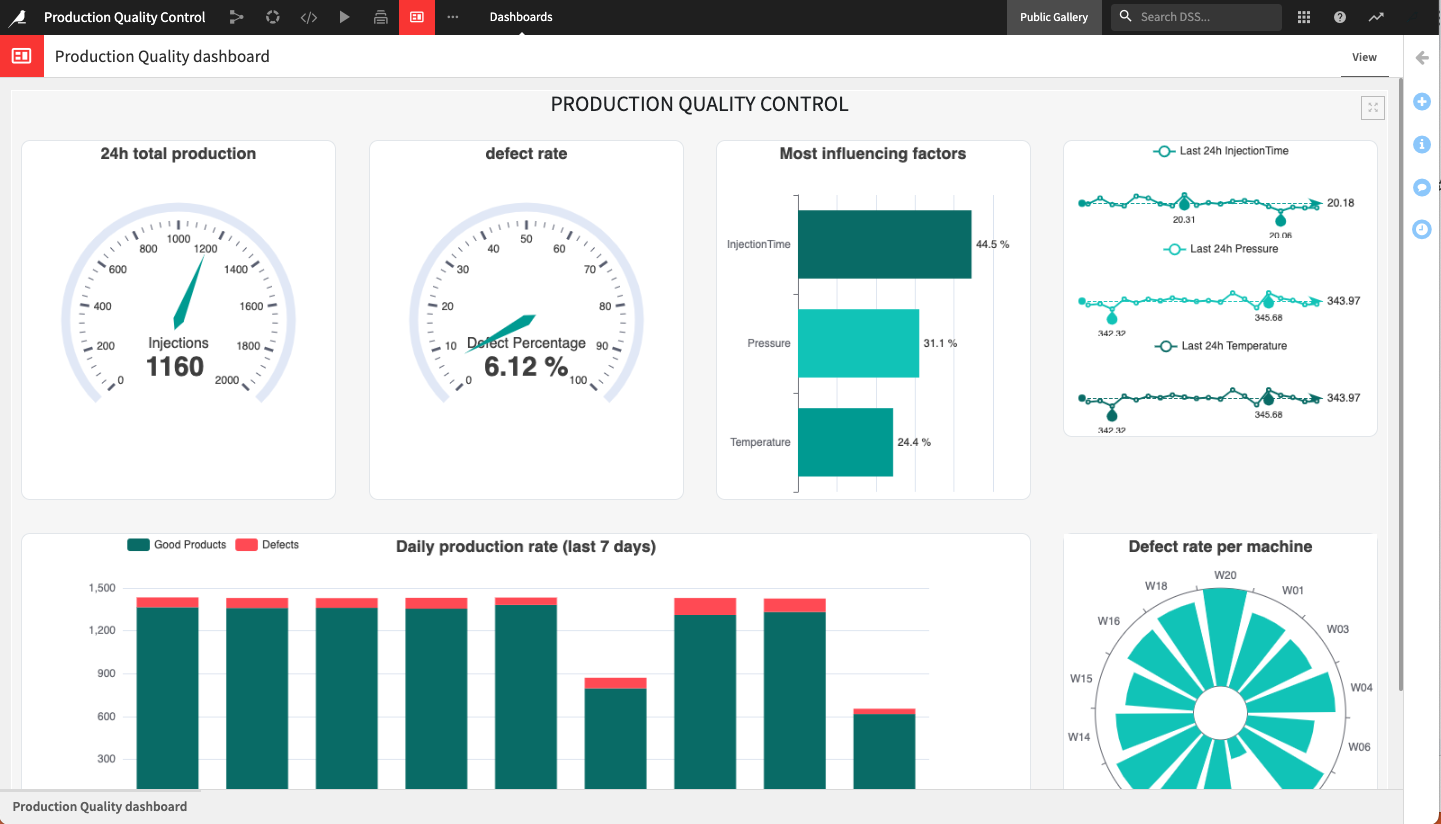
Dataiku allows you to create interactive dashboards and share them with business users for more informed decisions. Dashboards in Dataiku can include not just key metrics, but elements like:
- Filterable charts and datasets
- Machine learning (ML) model insights
- Data
- AI project health metrics
- Embedded web apps
- ... and much more.
Plus, scheduling data updates or triggering a refresh is simple with Dataiku. That means business stakeholders are always seeing the latest outputs and KPIs updates in near real time.
Custom Interactive Web Apps
Sometimes you do need to go beyond a dashboard. Business audiences must interactively use data and predictive insights to drive better customer experiences and outcomes.
Dataiku supports the development of interactive web applications with pre-built visual templates for a no/low code solution. Or go full-code and design a fully custom web app using leading data science visualization frameworks. This includes Dash, Streamlit, Shiny, Bokeh, R, JavaScript, and more.
Bonus: With Dataiku Applications, you don't need to have specialized application developer skills to create data-driven apps. Even non-technical data people can create a visual front end suitable for business consumers.
Dataiku's no-code solution packages a data project with a guided visual user interface. This way, anyone in the organization can generate AI outputs in a self-service way using their own data and settings.
What-If Analysis & Outcome Optimization
More and more, people on the business side will be leveraging predictive analytics and ML in their work. For example, imagine a marketer working with an ML model. This model might tells him which at-risk customers are most likely to react positively to email marketing. Or a quality engineer leveraging an ML model to understand the impact of defects.
It’s critical for business experts to have a baseline understanding of how these models work. This ensures humans stay in the loop for the best possible user experience and outcome. Ultimately, they must have the tools to properly question any outputs that don’t “feel” right.
For example, Dataiku provides interactive what-if analysis. This feature allows people to test different combinations of input values and examine the impact on predicted results. Moreover, they can even specify the outcome they want and let Dataiku go to work finding and prescribing the optimal set of conditions that lead to that outcome.
Equipped with these kinds of decision support tools, both technical and business professionals can build trust in predictive models. With more trust, they can apply knowledge of model behavior in practical ways.
Build Interactive Web Apps, Dashboards, & More With Dataiku
Want to deliver analytic dashboards and custom applications to business users for better, more data-driven decisions? Dataiku has you covered:
In addition to custom applications with both low/no code and full-code flexibility, compile and share data assets and results via workspaces. These are streamlined access points in Dataiku through which program stakeholders — technical or not — can easily access a variety of objects sourced from multiple projects, such as applications, dashboards, datasets, and wiki articles.
Dataiku workspaces make it easier for analytics teams to distribute their work to diverse audiences — a critical step in the adoption of Everyday AI.